
Hello guys,
my friend and exceptional trader Ziggy wrote another great article. It is about finding the best PT/SL. He published it into my Pro Forex Course forum but I think that you will also hugely benefit from reading it. Here it goes!
-Dale
Finding the sweet spot
As there are some new members of Dale’s club, and it’s been a while since I updated some info, I thought I’d share this with you.
First it’s important to understand the basis on which it’s compiled.
- All Dales leaves back to the beginning on FF
- Only those which have not moved more than 200 pips against the level before touching, no matter how old
- No trades where there was major news about to come out – extra time allowed for really big news items such as NFP, FOMC, ECB conference.
- No trades where the level has been tested – which I have used the following rule to decide on, comes within 5 pips of the level, moves away 15 pips.
- Entry is based upon FXCM charts ( even tho I don’t trade on them), short trades at the level, long trades at the level + spread (this is because the charts show the sell price, if you want to buy you generally need to be at least your spread below what the chart is showing)
- I have used the spreads I have to deal with, EU0.7, AU 0.8, UJ 0.7 & UC 1.0 ( although at night this is 3.0)
- Once a 10 pip profit could be banked the stop is moved to BE. This means on my info if I get 9.9 pips up and price then goes against it is recorded as a loss – it’s highly unlikely that anyone would allow that to happen but for testing purposes it has to be either yes or no. The other side of the coin is if it does get to +9.9 goes back to the entry point and then goes on to make PT, my info shows a PT.
So that’s the basis the info is pulled together on. I like to think of it as worst case, & anyone could achieve it – if you have smaller or even no spreads, as I know some do, then your results will be considerably better. Also if you actively micro manage trades, again your results are likely to be considerably better.
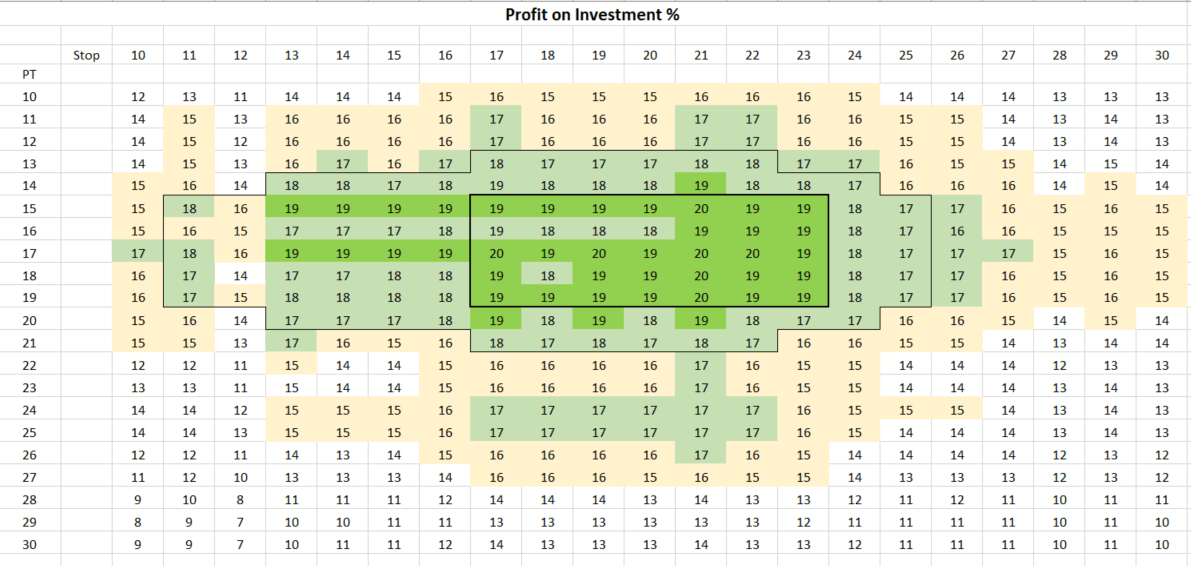
There is a matrix below which takes the above and applies all stops from 10-30, and all PT’s from 10-30 in order to find a “sweet spot”. Please don’t attempt to find the exact spot of greatest profitability as I can assure you in a months time it will be somewhere else, but what you can do is look at the relationship between stops & PT’s to establish something you are comfortable with and likely to allow to “happen”. Basically what I’m saying is don’t use a stop of 20 if it’s going to do your head in when you lose 20 pips, and don’t use a PT of 20 if you know that you’ll be itching to close the trade at +10. Use the info to find the sort of area you will be comfortable trading at, trading is stressful enough without adding to the discomfort!
What do the profit on investment % figures mean? It’s very simple, if I’ve used a 16 pip stop and a 14 pip PT the average result I get is 2.87 pips per trade. By dividing 2.87 into the risk of 16 pips I get 0.179, which I’ve rounded up to 18%.
Bizarrely by a fluke of numbers using a 12 pip stop on my data gives a dip in performance, this shows the danger of placing too much reliance on “information” as managed well you can achieve a great result using a12 stop as Dale & others do.
So have a look at the chart and you’ll see that on the basis of my criteria using any stop from 17-23 and any PT from 15-19 would have given a 19/20% profit on investment over the past 10 months.
Something which is important to me is how often I win, or at least don’t lose – I’ll sacrifice a percentage point or two of profitability to achieve a high strike rate, obviously if moving the stop to BE at +10 then we are safe once +10 is reached, this mini table gives the sort of strike rate you can expect at the different stop levels.

This is something which we all have to decide our comfort zone, I know mine and for me size of stop isn’t important, it’s consistency combined with overall profitability for me. As most will know I use a 20 pip stop, but if I didn’t have any data and someone presented this word doc to me, this is how I would be looking at it.
I’m not interested in anything with less than a 70% strike rate, so I’d be looking at stops of 16 plus, at 20 pips I could expect better than 75% and at 22 as much as 80%. I can expect a reasonable profit using any PT with those stops, and with a high strike rate a good degree of consistency. The lower my PT expectation the greater my number of profitable trades but from 13 onwards I can probably expect around 17-20% return on investment.
I don’t wish to take it any further than that as if I did I’d be trying to hone in on a backfitted optimum stop /PT – and there is no such thing as it will constantly evolve, but we have enough data on which to base a range of stops & PT’s that fit our “comfort zone”.
Hope it makes sense & you find it helpful.
-Ziggy
Thank you Ziggy! What would we do without you and Dale. I wish more traders or people who would like to trade profitably would find this course. I think we can learn so much from you about honest trading. 90% are just trying to rip people off.
Hi Ziggy,
thanks so much for writing such a helpful article and sharing your knowledge. Its super helpful.
I would like to clarify the point 2 in the article.
It means that if the level is not touched or tested and the market during the days would move more than 200pips away from the level and after come back, its not traded?