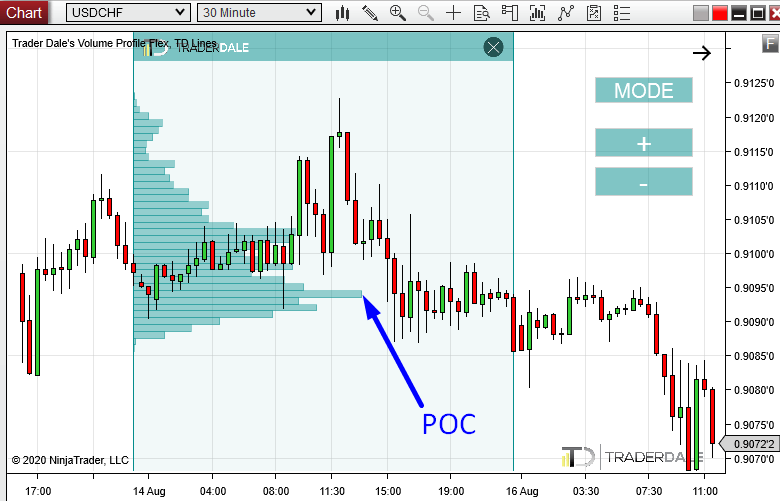
DEFINITION: Point Of Control (= POC) is a price level at which the heaviest volumes were traded.
The most important thing that the Volume Profile indicator shows is the POC. I dare say that if you used Volume Profile only for the purpose of identifying the POC, you would be a way better and trader then 99% of the retail traders. No matter what trading strategy you trade.
Why do I say this? Why is POC so important?
Point Of Control is so important because it shows the place where the most trading took place – where the biggest trading positions were accumulated.
POC shows the BIG guys!
Who accumulates those huge trading positions? The BIG guys – that’s the big financial institutions like hedge funds, pension funds, huge banks, etc…
It is those BIG guys who move and manipulate the markets.
It would be a huge advantage to know where they placed most of their positions, right? The good news is that WE HAVE THAT ADVANTAGE!
The only thing you need to do is to get the Volume Profile indicator which will show you the POC.
POC is the place where they placed most of their positions.
The cool thing about all this is that those institutions will never be able to hide from us. BIG guys = big trading positions. That means those guys will always stand out on the Volume Profile.
The bottom line is: POC is the place where the BIG guys who move and manipulate prices placed most of their positions. That’s why it is so important to know where the POC is.
In fact, POC is that important, that I base most of my trading strategies around it!
Daily POC – ideal for intraday trading
You can look for Point Of Control on many different time frames.
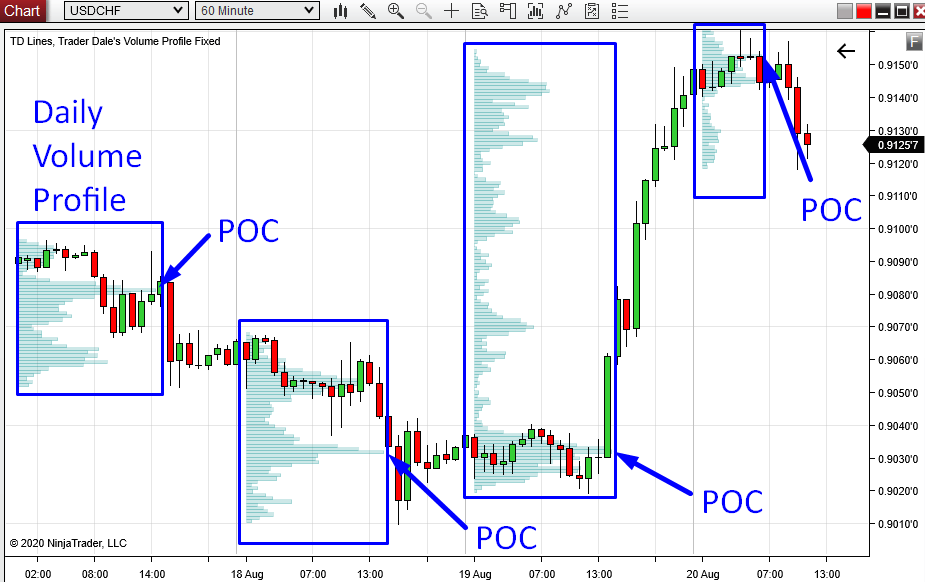
If you use for example Daily Volume Profile (it displays how volumes were distributed each day), then every day will have its own POC.
The picture below shows Daily Volume Profiles printed on a 60 Minute chart. Every day a new Daily profile with a new Daily POC is printed.
Weekly POC – ideal for intraday trading
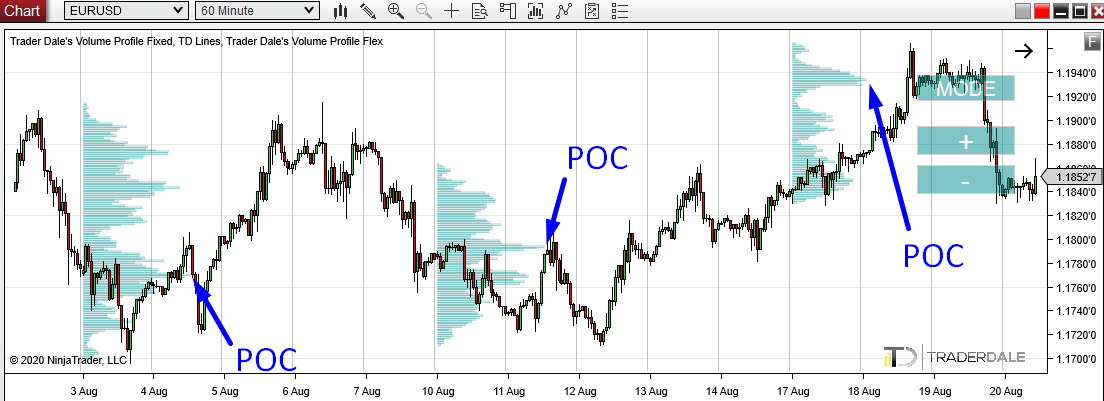
The picture below shows Weekly Volume Profiles. That means that every week a new profile starts to develop.
Each of those profiles has its own POC. Those POCs are the most important places in each profile!
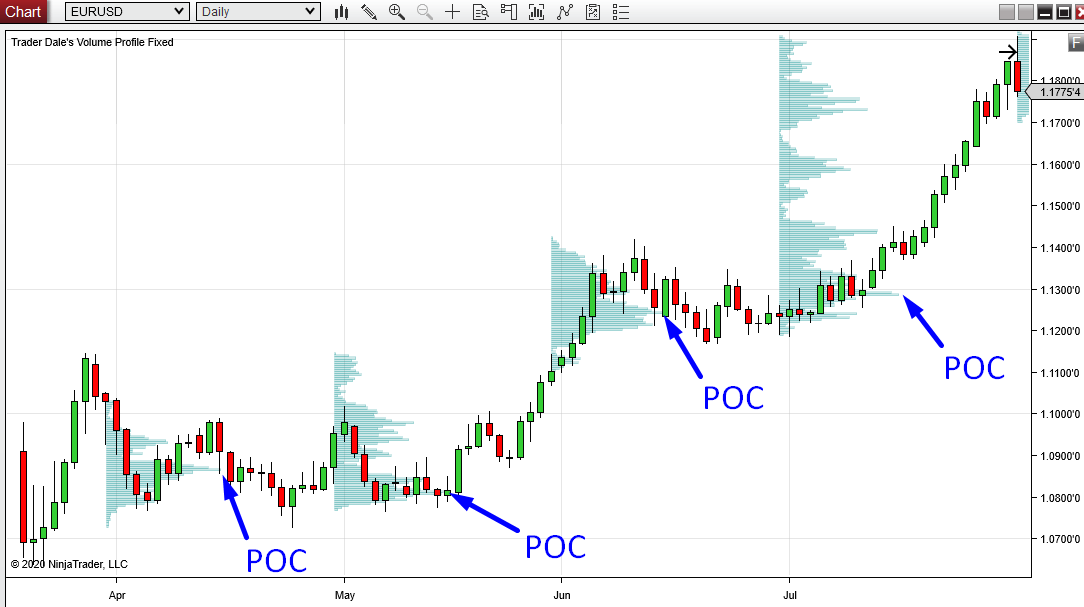
Monthly POC – ideal for swing trading
Very similarly as in the previous two cases, the Monthly POC shows where the heaviest volumes were traded each month.
A Monthly POC shows on a Monthly Volume Profile which is good to use for swing trading.
The picture below shows the Monthly Profiles on a Daily time frame:
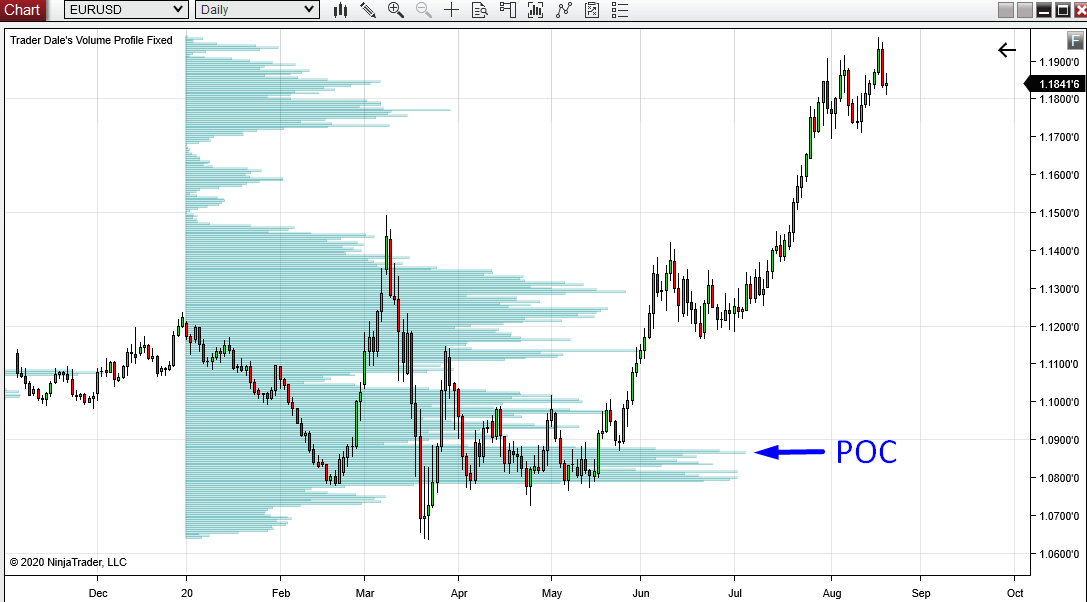
Yearly POC – ideal for swing trading
The Yearly POC is the place where the heaviest volumes throughout the whole year got traded.
The Yearly POC is best used for swing trading.
The picture below shows Yearly Volume Profile on EUR/USD with POC at 1.0866. For traders who trade long-term trades, this is the most important level this year! Most of the trading in 2020 took place there.
The BIG guys who we are tracking using the POC operate on many different time frames.
If you are an intraday trader then it is best to track Daily POC or Weekly POC.
If you are trading swings, then it is best to look for Monthly POC or Yearly POC.

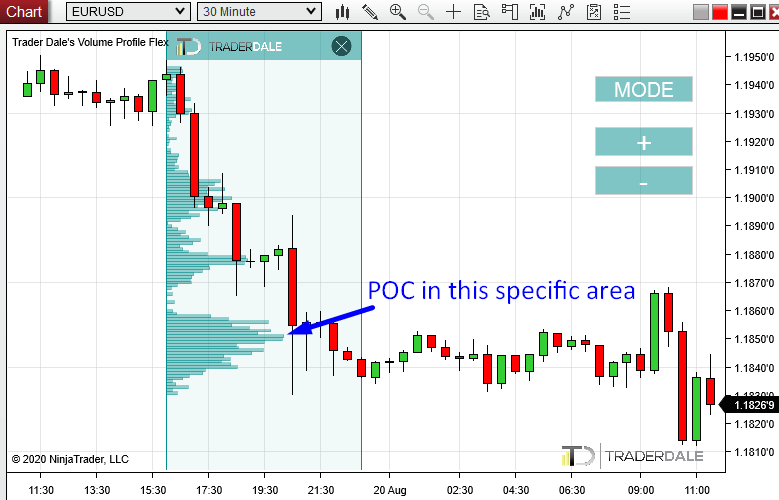
POC on Flexible Volume Profile
Flexible Volume Profile is my custom-made tool, which shows volumes in any area you are interested in. This way you are not fixed to specific time period (Day, Week, Month, Year…).
This tool will show you the volume distribution in every area you select. It will also show you where in this specific area the POC is (where the most volumes got traded).
The picture below shows Flexible Volume Profile which I used on a specific area (trend area which took place yesterday on EUR/USD). The POC of this area was at 1.1850.
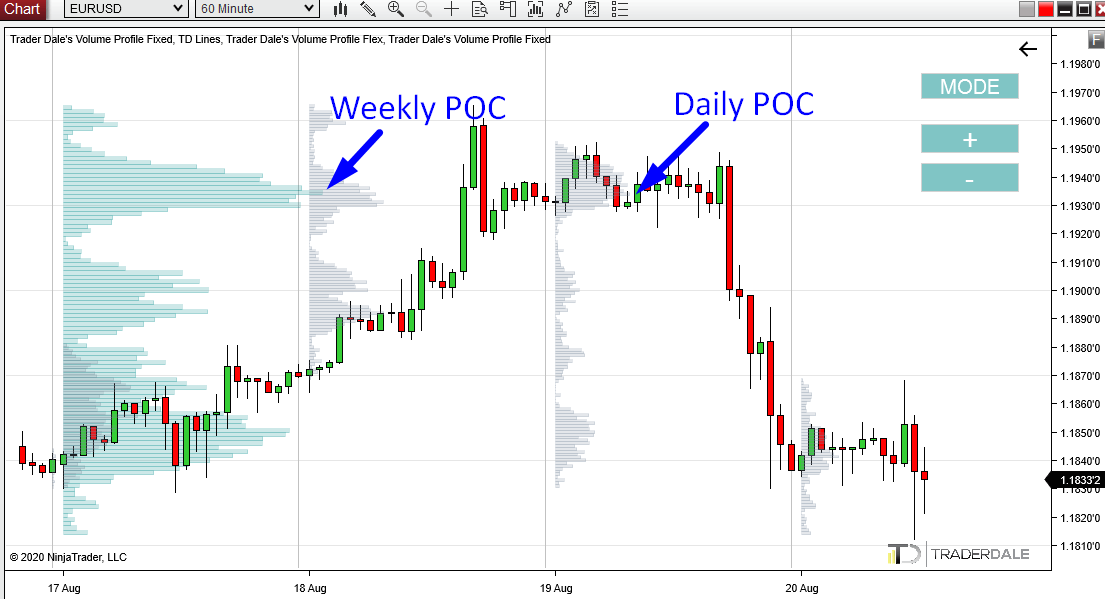
Combination of POCs
Sometimes there is a nice confluence when two or more POCs align at the same price level.
This could be for example Daily POC and a Weekly POC.
In this case, it would mean that the heaviest volumes traded at the given day were also the heaviest volumes traded in that given week.
The example below shows a confluence between Weekly POC and Daily POC on EUR/USD. They both are at 1.1934. This makes this price level super important, because most of the volumes of the big guys got traded there.
*The green Volume Profile shows a Weekly Volume Profile, and the grey one is shows Daily Volume Profiles.

How to trade the POC
The basic skill of every Volume Profile trader is to know how to use the POC to their advantage and how to trade with it. Knowing what the the POC is and knowing how to trade it is in my opinion the best edge. At least the best edge I found in my 12+ years trading career.
You can build many profitable strategies around trading the POC.
I am going to share some of the basics you can work with and build on.
Why the price reacts to POC
If you go through the charts you will notice that the price reacts to POCs. It very often works as a strong Support or a Resistance. Like for example in the picture below:
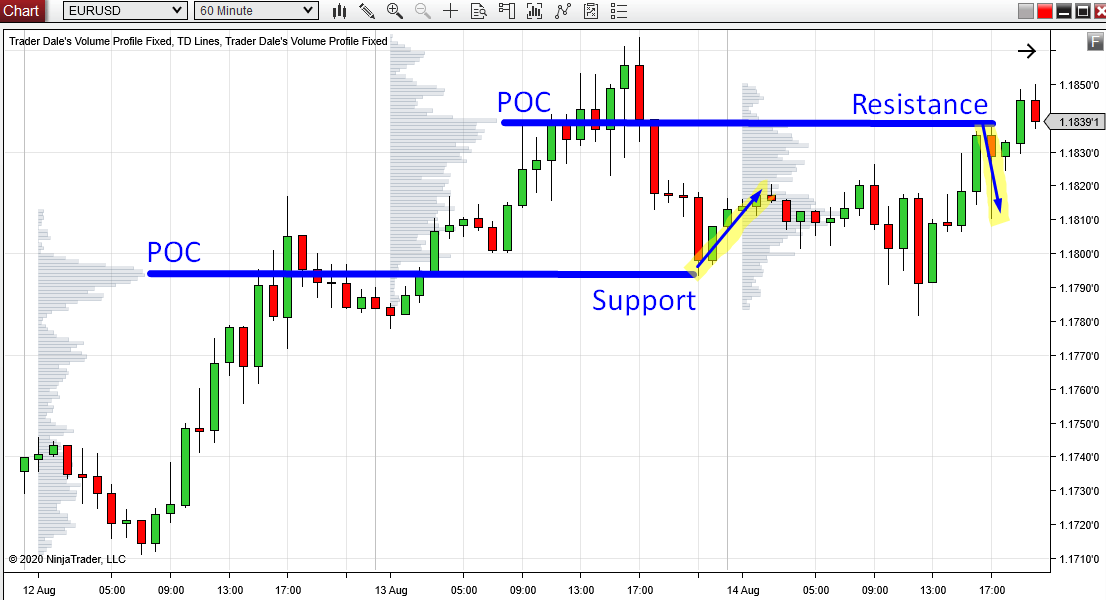
But why does the price react to POC? Why does the POC work as a Support/Resistance zone?
Big trading institutions can’t enter their trading positions like we do by simply clicking one button. They operate with insane amounts of money and it takes time to enter their trades. They most often enter their trades in a rotation (in volume accumulation area) and from there they start a trend.
In other words – you look for a POC (that’s the area where they accumulated their positions) and then you want to see the price go upwards or downwards from it.
If the price goes upwards from POC, then the heavy volumes accumulated there were hidden volumes of strong buyers.
If the price goes downwards from POC, then the heavy volumes were strong sellers.
Those trading institutions often defend their big trading positions which they have planned and which they have been entering for a long time.
Because of this, when the price makes a pullback – back into the POC area, then those BIG guys become active again and they defend their positions.
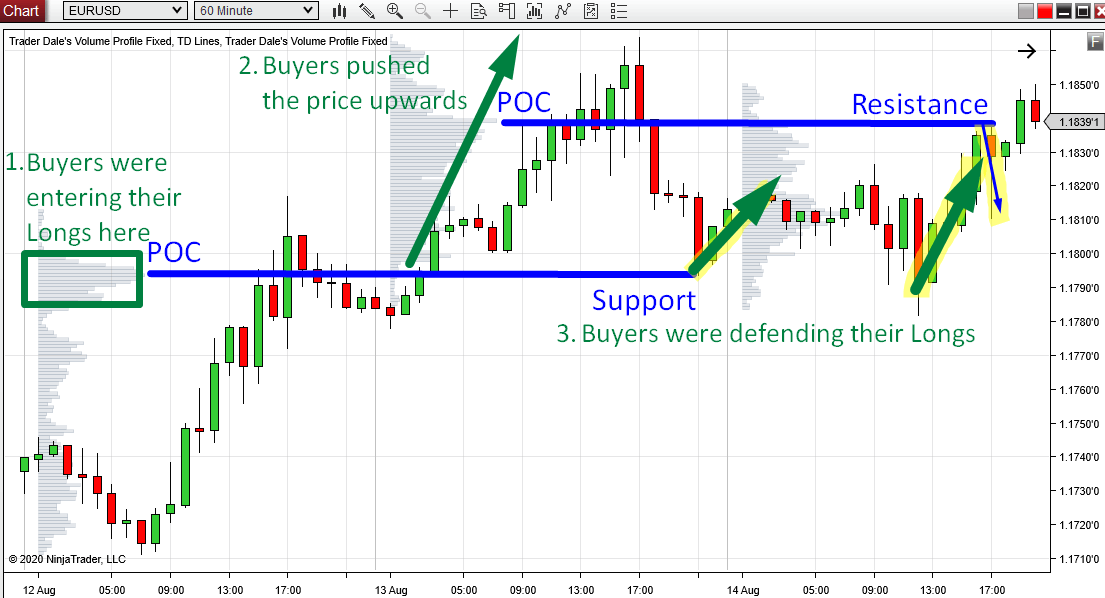
EXAMPLE: Why the price reacts to POC
Lets make this clearer by a concrete example:
1. Buyers were entering their Long positions. They used a massive amounts of volumes and this created a Daily POC.
2. Then those buyers pushed the price upwards.
3. When the price made it back to the POC (pullback), the buyers became active again and they started to defend their Long positions. They successfully managed that and pushed the price upwards again.
How did they managed that? They started a new and aggressive buying activity (with Market Orders) and by that they started a snowball effect and lured more market participants into buying. This started a new uptrend and the huge institutional trading positions turned into green numbers again.
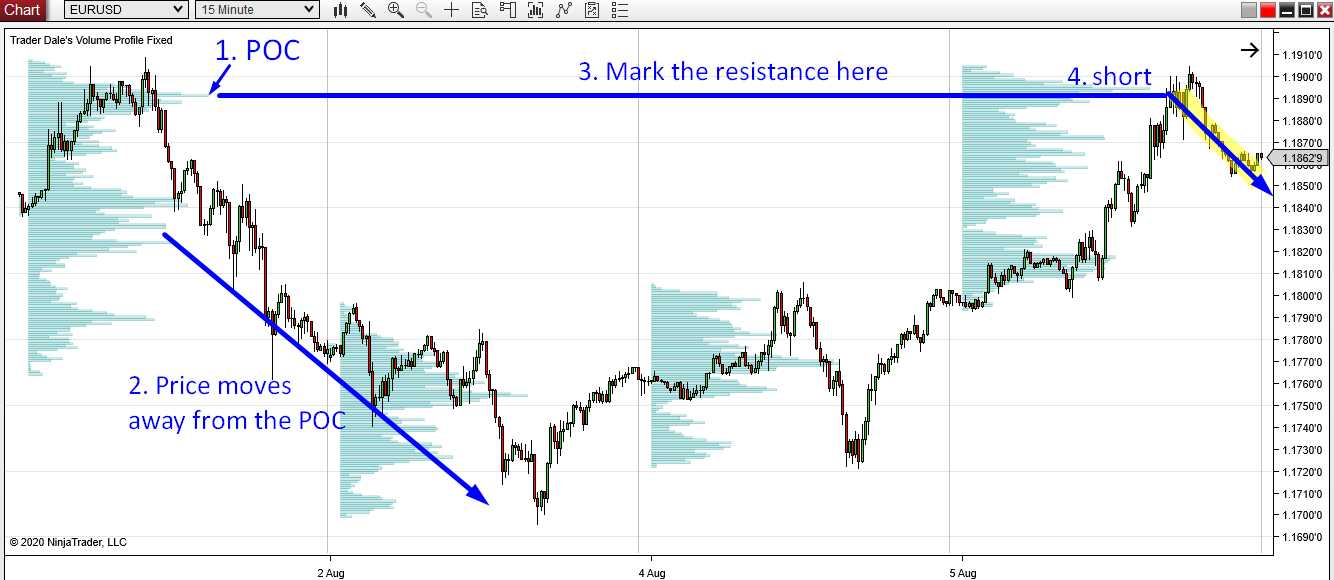
POC trading strategy
The example above may have given you some ideas on how to profit on trading the POC. The easiest way you can build your strategy around is this:
1. Identify a POC on your preferred time frame.
2. Wait until the price starts moving away from this POC (up or down).
3. Mark this POC into your chart and wait until the price makes it back into it.
4. Enter a trade based on the direction the price initially went from the POC.
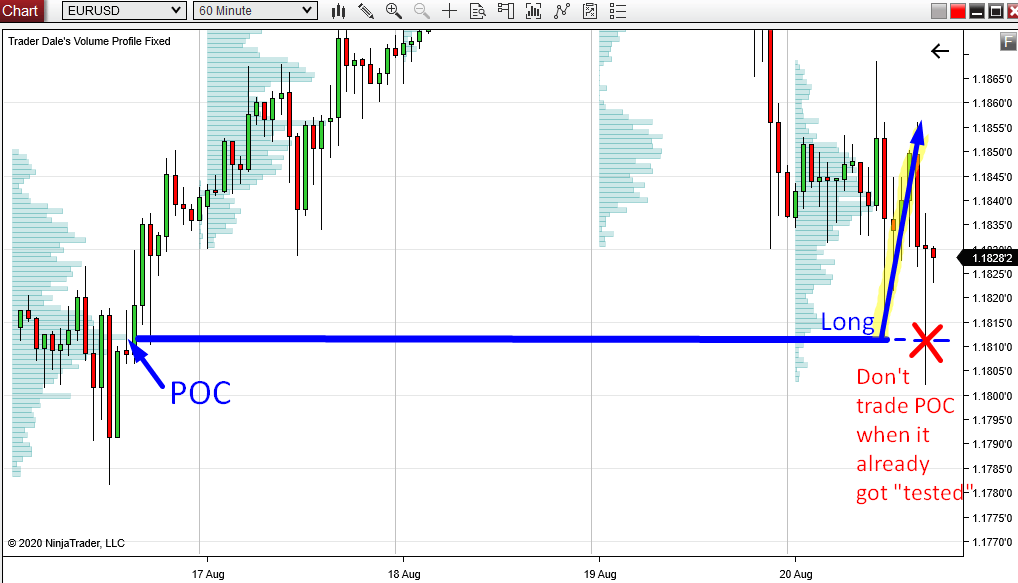
When POC was tested once I personally don’t trade from it anymore. 2nd tests do not have as high win rate as the 1st tests.
Do you want ME to help YOU with your trading?
What if POC fails?
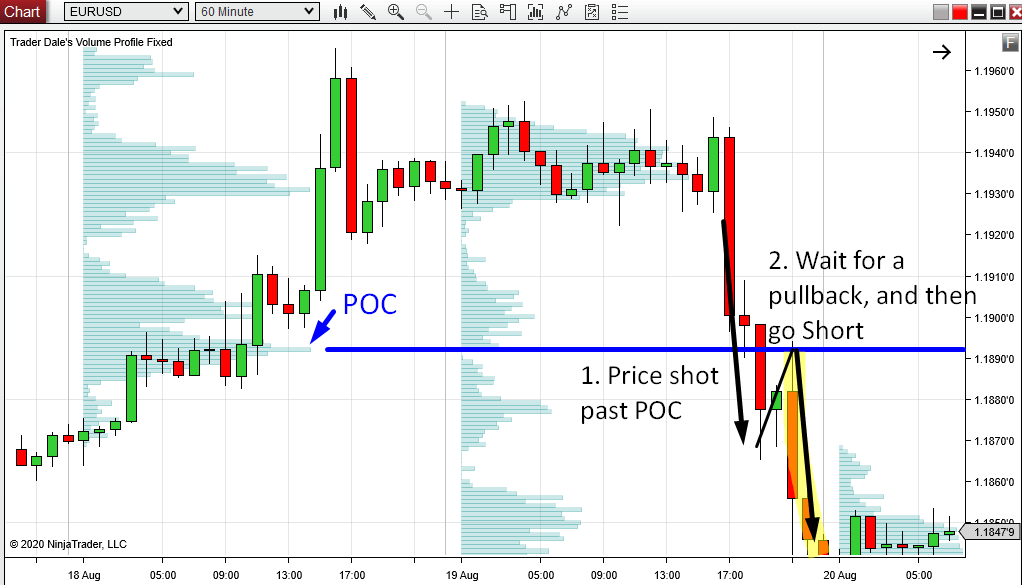
Sometimes the price just fails to react to POC and shoots past it.
This happens most often, when there is a change of sentiment in the market. It can be caused by news or for example by buyers/sellers who grow in strength and aggression and who are determined to move the price through the POC.
In such a case, it is best to enter a Reversal trade.
A Reversal trade essentially means entering in an opposite direction (but from the same trading level).
If you would like to learn more about Reversal Trades you can do so here:
STRATEGY GUIDE: Reversal trades
Here is an example of a Reversal trade on EUR/USD:
Where to go next?
There are many profitable Volume Profile strategies explained in a great detail in my Trading Course.
If you would like to learn them you can enroll and join us here:
If Volume Profile is something completely new to you, you can learn the basics in those articles:
I hope you guys liked this article, let me know what you think in the comments below!
Happy trading!
-Dale
Its very nice strategy . I like that .thank you very much sir
I’m glad you like it Eric, thanks for your comment. 🙂
as usual, I find your articles are simple, clear, reliable and effective. Thank you
Thank you very much! As always, I’m glad I’m helping. 🙂
𝐈𝐧𝐯𝐞𝐬𝐭 𝟓𝟎𝟎$ 𝐆𝐞𝐭 𝐃𝐚𝐢𝐥𝐲 𝟑𝟎𝟎$ 𝐏𝐫𝐨𝐟𝐢𝐭
𝐈𝐧𝐯𝐞𝐬𝐭 𝟏𝟎𝟎𝟎$ 𝐆𝐞𝐭 𝐃𝐚𝐢𝐥𝐲 𝟓𝟎𝟎$ 𝐏𝐫𝐨𝐟𝐢𝐭
𝐈𝐧𝐯𝐞𝐬𝐭 𝟐𝟎𝟎𝟎$ 𝐆𝐞𝐭 𝐃𝐚𝐢𝐥𝐲 𝟏𝟐𝟎𝟎$ 𝐏𝐫𝐨𝐟𝐢𝐭
𝐈𝐧𝐯𝐞𝐬𝐭 𝟑𝟎𝟎𝟎$ 𝐆𝐞𝐭 𝐃𝐚𝐢𝐥𝐲 𝟏𝟓𝟎𝟎$ 𝐏𝐫𝐨𝐟𝐢𝐭
𝐈𝐧𝐯𝐞𝐬𝐭 𝟒𝟎𝟎𝟎$ 𝐆𝐞𝐭 𝐃𝐚𝐢𝐥𝐲 𝟐𝟎𝟎𝟎$ 𝐏𝐫𝐨𝐟𝐢𝐭
𝐈𝐧𝐯𝐞𝐬𝐭 𝟓𝟎𝟎𝟎$ 𝐆𝐞𝐭 𝐃𝐚𝐢𝐥𝐲 𝟑𝟎𝟎𝟎$ 𝐏𝐫𝐨𝐟𝐢𝐭
𝐖𝐢𝐭𝐡 𝐬𝐮𝐫𝐞 𝐚𝐧𝐝 𝐜𝐨𝐧𝐟𝐢𝐫𝐦 𝐬𝐢𝐠𝐧𝐚𝐥𝐬
𝐈𝐧𝐛𝐨𝐱 @admin
Wa.me/+918253081822
Love the article very informative and clear and easy to understand.
Thank you John, that’s exactly my intention!
Hey, for the REVERSAL TRADE, how do you determine your take profit levels? (Do you use fib retracement, …)
How do you determine the TAKE PROFIT levels?
Hi Scobby, I use volume-based tp which I explained in my 15+ hour volume profile course. You can also use a fixed tp/sl range or even further align it with the volatility using ATR.
dear Dale,
what do you think of combining thIs indicator and the VWAP?
thanks, kind regards
Hi Marco, that’s what I’m doing all the time! 🙂
Please check some of my weekly ideas videos on YouTube.
thanks, I had not seen other pages, besides this one.
strangely the VWAP indicator on my platform has just one line, without deviations…
No worries Marco! Please send me an email at contact@trader-dale.com with screenshots of your VWAP settings. I’m sure they can be adjusted to show 1st and 2nd deviations as well.
Cheers!
Amazing Dale.
awesome
Trading with point of control are like the pivot points which ensure trading statistics. Trader can take initiative to understand the current situation.
The most thorough trading article I’ve read to date. I’ll be back for more!
Hi
thanks a lot for your information about Volume profile and trading strategy with it, but can I ask you how about win rate of these strategies ? Have you back tested these strategies?
Thank you again
If we use another indicator that comes to support our guests it is better bc it reinforces our belief that the price will react at that price level (POC)
𝐈𝐧𝐯𝐞𝐬𝐭 𝟓𝟎𝟎$ 𝐆𝐞𝐭 𝐃𝐚𝐢𝐥𝐲 𝟑𝟎𝟎$ 𝐏𝐫𝐨𝐟𝐢𝐭
𝐈𝐧𝐯𝐞𝐬𝐭 𝟏𝟎𝟎𝟎$ 𝐆𝐞𝐭 𝐃𝐚𝐢𝐥𝐲 𝟓𝟎𝟎$ 𝐏𝐫𝐨𝐟𝐢𝐭
𝐈𝐧𝐯𝐞𝐬𝐭 𝟐𝟎𝟎𝟎$ 𝐆𝐞𝐭 𝐃𝐚𝐢𝐥𝐲 𝟏𝟐𝟎𝟎$ 𝐏𝐫𝐨𝐟𝐢𝐭
𝐈𝐧𝐯𝐞𝐬𝐭 𝟑𝟎𝟎𝟎$ 𝐆𝐞𝐭 𝐃𝐚𝐢𝐥𝐲 𝟏𝟓𝟎𝟎$ 𝐏𝐫𝐨𝐟𝐢𝐭
𝐈𝐧𝐯𝐞𝐬𝐭 𝟒𝟎𝟎𝟎$ 𝐆𝐞𝐭 𝐃𝐚𝐢𝐥𝐲 𝟐𝟎𝟎𝟎$ 𝐏𝐫𝐨𝐟𝐢𝐭
𝐈𝐧𝐯𝐞𝐬𝐭 𝟓𝟎𝟎𝟎$ 𝐆𝐞𝐭 𝐃𝐚𝐢𝐥𝐲 𝟑𝟎𝟎𝟎$ 𝐏𝐫𝐨𝐟𝐢𝐭
𝐖𝐢𝐭𝐡 𝐬𝐮𝐫𝐞 𝐚𝐧𝐝 𝐜𝐨𝐧𝐟𝐢𝐫𝐦 𝐬𝐢𝐠𝐧𝐚𝐥𝐬
Wa.me/+918253081822
After stumbling through 2 years of not being able to profit from trading I found Trader Dale! Have not purchased anything yet but will do as soon as I am able to… Just reading his volume profile book I have b3n able to significantly improve my trading and after only 1 week of reading it! Thank you Dale!
𝐈𝐧𝐯𝐞𝐬𝐭 𝟓𝟎𝟎$ 𝐆𝐞𝐭 𝐃𝐚𝐢𝐥𝐲 𝟑𝟎𝟎$ 𝐏𝐫𝐨𝐟𝐢𝐭
𝐈𝐧𝐯𝐞𝐬𝐭 𝟏𝟎𝟎𝟎$ 𝐆𝐞𝐭 𝐃𝐚𝐢𝐥𝐲 𝟓𝟎𝟎$ 𝐏𝐫𝐨𝐟𝐢𝐭
𝐈𝐧𝐯𝐞𝐬𝐭 𝟐𝟎𝟎𝟎$ 𝐆𝐞𝐭 𝐃𝐚𝐢𝐥𝐲 𝟏𝟐𝟎𝟎$ 𝐏𝐫𝐨𝐟𝐢𝐭
𝐈𝐧𝐯𝐞𝐬𝐭 𝟑𝟎𝟎𝟎$ 𝐆𝐞𝐭 𝐃𝐚𝐢𝐥𝐲 𝟏𝟓𝟎𝟎$ 𝐏𝐫𝐨𝐟𝐢𝐭
𝐈𝐧𝐯𝐞𝐬𝐭 𝟒𝟎𝟎𝟎$ 𝐆𝐞𝐭 𝐃𝐚𝐢𝐥𝐲 𝟐𝟎𝟎𝟎$ 𝐏𝐫𝐨𝐟𝐢𝐭
𝐈𝐧𝐯𝐞𝐬𝐭 𝟓𝟎𝟎𝟎$ 𝐆𝐞𝐭 𝐃𝐚𝐢𝐥𝐲 𝟑𝟎𝟎𝟎$ 𝐏𝐫𝐨𝐟𝐢𝐭
𝐖𝐢𝐭𝐡 𝐬𝐮𝐫𝐞 𝐚𝐧𝐝 𝐜𝐨𝐧𝐟𝐢𝐫𝐦 𝐬𝐢𝐠𝐧𝐚𝐥𝐬
𝐈𝐧𝐛𝐨𝐱 @admin
Wa.me/+918253081822
𝐈𝐧𝐯𝐞𝐬𝐭 𝟓𝟎𝟎$ 𝐆𝐞𝐭 𝐃𝐚𝐢𝐥𝐲 𝟑𝟎𝟎$ 𝐏𝐫𝐨𝐟𝐢𝐭
𝐈𝐧𝐯𝐞𝐬𝐭 𝟏𝟎𝟎𝟎$ 𝐆𝐞𝐭 𝐃𝐚𝐢𝐥𝐲 𝟓𝟎𝟎$ 𝐏𝐫𝐨𝐟𝐢𝐭
𝐈𝐧𝐯𝐞𝐬𝐭 𝟐𝟎𝟎𝟎$ 𝐆𝐞𝐭 𝐃𝐚𝐢𝐥𝐲 𝟏𝟐𝟎𝟎$ 𝐏𝐫𝐨𝐟𝐢𝐭
𝐈𝐧𝐯𝐞𝐬𝐭 𝟑𝟎𝟎𝟎$ 𝐆𝐞𝐭 𝐃𝐚𝐢𝐥𝐲 𝟏𝟓𝟎𝟎$ 𝐏𝐫𝐨𝐟𝐢𝐭
𝐈𝐧𝐯𝐞𝐬𝐭 𝟒𝟎𝟎𝟎$ 𝐆𝐞𝐭 𝐃𝐚𝐢𝐥𝐲 𝟐𝟎𝟎𝟎$ 𝐏𝐫𝐨𝐟𝐢𝐭
𝐈𝐧𝐯𝐞𝐬𝐭 𝟓𝟎𝟎𝟎$ 𝐆𝐞𝐭 𝐃𝐚𝐢𝐥𝐲 𝟑𝟎𝟎𝟎$ 𝐏𝐫𝐨𝐟𝐢𝐭
𝐖𝐢𝐭𝐡 𝐬𝐮𝐫𝐞 𝐚𝐧𝐝 𝐜𝐨𝐧𝐟𝐢𝐫𝐦 𝐬𝐢𝐠𝐧𝐚𝐥𝐬
𝐈𝐧𝐛𝐨𝐱 @admin
Wa.me/+918253081822