Hello my friends!
In the previous article Market Profile – introduction I briefly mentioned that there are some different shapes of Market Profile histograms (profiles). I showed you some examples but I didn’t elaborate any further. In this article I would like to go a bit deeper and show you some of the most common shapes Market Profile histogram can form. I will also show you what are the most significant places to watch and trade in each different form. Lets get to it!
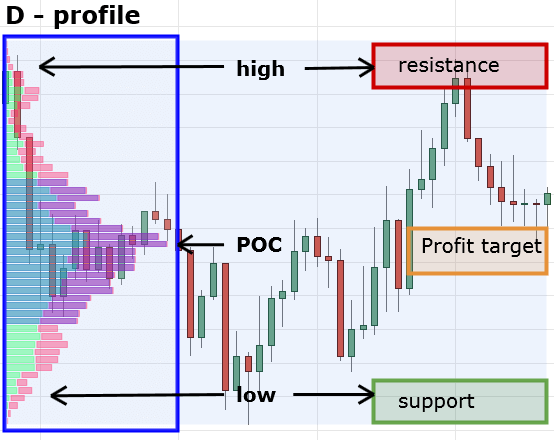
D-profile
The most common and well known is the D-profile. It’s shape is similar to a letter “D”. It is formed when market is “balanced“. Both buyers and sellers found temporary balance there and they are in a rotation/cummulation. This means that one side of the market isn’t more aggressive than the other. It is used for cummulation of volumes by institutions and other big players.
There are 3 significant places to be aware of. High and low of the profile and POC (Point of control = place with the highest volumes).
- Places with the highest volumes around high/low of this profile are strong support/resistance zones. Usually there can be seen some aggression around high and low of this profile – aggressive sellers at high, aggressive buyers at low. I myself trade situations like this – short trades at marked resistance areas and long trades at support areas.
- POC is a good place for a profit target
Here is a typical D-profile:
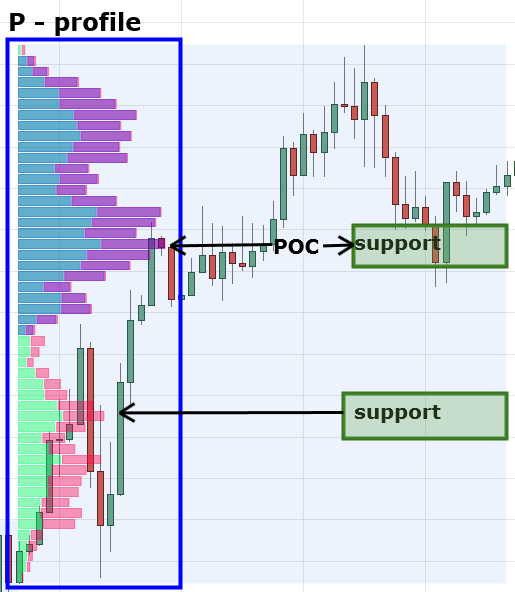
P – profile
It’s shape is simillar to a letter “P”. It is formed when there are aggressive buyers and weak sellers. If you look at price action chart you will most likely see bull candles (aggressive buyers) and then rotation at the day’s high (weak sellers).
P-profiles can be usually seen: 1. when the market is in uptrend or 2. at the end of downtrend (this is not a hard rule though).
Most significant places of P-profile are POC and place with higher volume in the thin area of the profile.
- POC – good support area if market goes up next day(s) and makes a pullback back there. The price doesn’t have to return to this area immediatelly (the next day). It can take several days before the price comes back to this POC.
- Higher volumes in thin area of profile – in these places aggression of buyers was most significant – they put heavy volumes in the market to move the price higher. If the price returns there is high probability that these aggressive buyers will become aggressive again and push the price higher again.
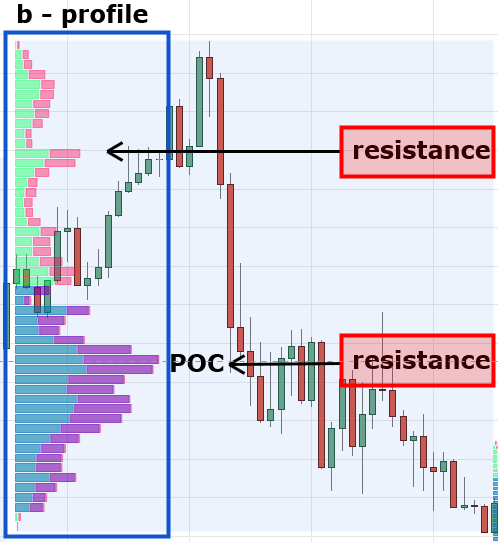
b-profile
=the exact opposite of P-profile.
It’s shape is simillar to a letter “b”. It is formed when there are aggressive sellers and weak buyers. If you look at price action chart you will most likely see bear candles (aggressive sellers) and then rotation at the day’s low (weak buyers).
b-profiles can be usually seen: 1. when the market is in downtrend or 2. at the end of uptrend (this is not a hard rule though).
Most significant places of b-profile are POC and place with higher volume in the thin area of the profile.
- POC – good resistance area if market goes down next day(s) and makes a pullback back there. The price doesn’t have to return to this area immediatelly (the next day). It can take several days before the price comes back to this POC.
- Higher volumes in thin area of profile – in these places aggression of sellers was most significant – they put heavy volumes in the market to move the price lower. If the price returns there is high probability that these aggressive sellers will become aggressive again and push the price lower again.
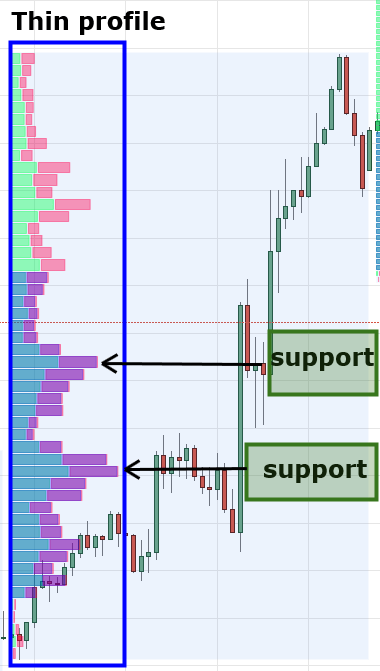
Thin profile
Thin profiles appear when there is a strong uptrend or downtrend. These profiles are thin because one side of the market is very aggressive and moves the price very quickly in one direction. There is not much time for volume cummulation because the market is moving too fast.
Most significant places in Thin profile are places where the price stopped moving for a while and made some volumes. In these places aggressive market paricipants added fuel to the moving market. If the price returns to these zones these aggressive participants will probably become aggressive again and add some more fuel to the market to defend their positions. In uptrend these are good support zones, in downtrend these zones are good resistances.
Thin profile in an uptrend:
Not all profiles you encounter will fit exactly in description of these four basic ones I showed you. Most of time you won’t be working with the “perfect shape” profiles. However, if you use your imagination a bit there shouldn’t be a profile you wouldn’t be able to fit in any of these 4 categories.
If you want to get good with trading with Market Profile I strongly encourage you to study this article and then start watching and recognising these types of profiles in your real trading. Try to fit every volume you see into one of the 4 categories and then try to figure out where support/resistances are.
I am sure this will get your trading skills to a much higher level!
Happy trading
Dale
How do I add this volume activity by price to my chart??? What is the name or indicator that I use?
I got the TD line added into Meta4 but when I put the daily lines in I can’t find them in Meta4???
You need to download market profile from my Downloads section. Regarding the TD lines, you need to download Templates from Daily levels page.
Is the “market profile” in the downloads section the same as the picture?
No, it is a different one.
In the picture there is MP from here: http://tradingview.go2cloud.org/aff_c?offer_id=2&aff_id=4175
In my downloads section there is MP for MT4.
Hello Dale
new member here. Question about the market profile (MP) shapes, where you are describing as … if market goes up next day(s) for P and goes down next day(s) for b profiles…… I am an intraday scalper. Would it be wise to look for these shapes and trade them correctly with sup and res lines for P and b or other shapes for intraday scalping or do I have to wait for next day(s) price action as described. I don’t swing trade, I only intraday trade the futures markets and need to close positions the same day to avoid day margin violations.
POC – good support area if market goes up next day(s) and makes a pullback back there. The price doesn’t have to return to this area immediately (the next day). It can take several days before the price comes back to this POC.
Thanks – Rose
Hello Rose,
you don’t need to wait for another day. Since you are a scalper, you can use different profiles – I suggest 4 hour fixed profiles instead of daily profiles (my Volume Profile Pack can do that). Or you can use the flexible profile and analyze even smaller parts of the charts.