Video Transcript:
Hello
everyone, it’s Dale here. In this video, I’d like to show you how to trade when
the volatility dramatically changes—and that’s exactly what we are experiencing
right now. The volatility has spiked quite a lot because of the tariffs, and we
need to adjust. If we don’t, then we’re probably going to lose a lot of
money—and we don’t want that.
Now,
the reason for the increase in volatility is the tariffs. That’s the big topic
all across the board. But you know, it doesn’t need to be the tariffs. The
reason for the change in volatility could be a rate decision, uncertainty, a
crisis—it could be anything. But the important thing is that volatility
changed, and we need to adapt.
The
first thing I’m going to show you is a volatility index. This is the chart of
the volatility index. It is a daily chart, so each candle shows one day. As you
can see, the average was somewhere around, let’s say, 15 to 20—that’s the
average volatility. Right now, there’s this massive spike. So, you can track
the volatility through the VIX index right here, and this will show you how the
volatility changes over time.
But
we don’t need to look at this specific index. We can look, for example, at EUR/USD.
This is a daily chart, and what I’ve loaded up here—this indicator at the
bottom—that’s the ATR indicator. The way I set that indicator is just for a
5-day period, so it adapts to changes quickly. Let me show you. If I go to
indicators and to the ATR settings, then I set it for a 5-day period.
Let
me scroll back a bit so we can see the bigger picture. As you can see, in the
past, it was roughly around 70. This is like average daily volatility on the
euro, right? 70, maybe 80 pips average daily volatility for a very long time.
But now, we are around 72 pips per day—that’s the average volatility on the
euro.
Where
I’m going with this is: if you were trading EUR/USD with, say, a fixed
10 pip stop loss and 10 pip take profit, and you used that kind of setup, then
yeah—during this calm period, it was quite fine. But what do you do when the
volatility changes dramatically like this? You can’t really use this setting anymore,
because you’d simply get stopped out too soon. Your take profit would be too
small, and your trading would just be terrible, right?
So,
what to do? How do you quickly adapt to changes in volatility like this?
Now,
what I’m going to show you is a method I’ve been practicing for many years, and
it has never let me down. Let me switch to an intraday chart, and I’ll
demonstrate on two trades which I took earlier today. The main message here is
that you want to place your stop loss and take profit at logical places on the
chart—not fixed take profit and stop loss like 10 or 15 pips or whatever. It
needs to be at a logical place.
What
I recommend is placing your stop loss behind a support or resistance zone, and
your take profit before a support or resistance zone. The cool thing about this
is that when the volatility changes, the support and resistance zones also get
wider or tighter. So, they adapt—the chart adapts—and this automatically adapts
your stop loss and take profit according to the volatility.
Let
me show you with those examples—it will be way clearer.
This
trade, which I took on USD/CAD, was a short—right here at this line.
This was a short. Because I placed my stop loss behind a barrier, I placed it
behind this heavy volume zone. The heavy volume zone represents a barrier.
Strong heavy volume zones always represent strong barriers—or in other words,
support and resistance zones. So, the way I placed my stop loss was behind this
heavy volume barrier, also at the top of this swing point. That’s what I also
do—ideally, the stop loss goes behind a heavy volume zone and at the top of a
little swing point like this. So, the stop for this trade was right here. The
barrier—or, in other words, the resistance zone—was this whole zone, and the
stop goes behind it. This is the stop loss which is behind the barrier. The
volume cluster here—that’s the barrier.
Now,
the take profit needs to go before a strong support or resistance zone. In this
case, there was a heavy volume zone standing in the way of my short. I entered
the short in here, like this, and then this heavy volume zone was standing in
the way—presented a potential support—starting in here. But the whole support
zone was obviously wider. It’s always a zone, not just one level. But this was
the beginning of that support zone, and that’s why I took the take profit right
here.
So,
as you can see, I followed this rule: stop loss went behind resistance, and
take profit went before support. The cool thing is that the volatility doesn’t
really matter. As you can see, I never really cared how many pips this was. I
can tell you now it was roughly 25 pips—but I don’t really care. Because the
volatility increased, and the barrier—based on this volume cluster—increased as
well. That’s what determined that the stop loss would be here.
Let
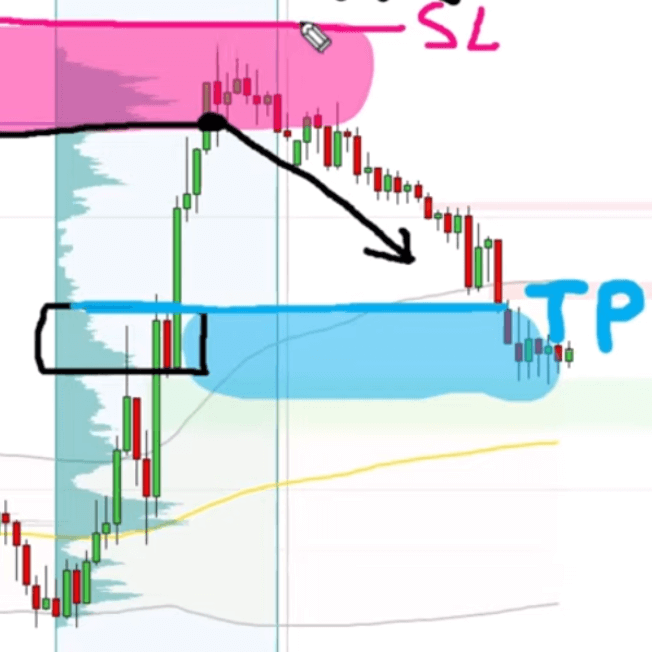
me show you the other trade, which I took earlier today. It was this one on USD/CHF,
and the trade was based on this strong rejection of higher prices and on this
significant volume zone within the rejection. This red line you see here—this
dotted line—I’ll just mark it in black. That was the place where I went short
from. The stop loss, again, was according to the volumes here. I want to place
the stop behind the significant volume zone and also at the top of the little
swing point—the same approach as with the previous example. So, the stop was in
here.
Again,
the volatility dictates where the stop loss goes. I don’t really care how many
pips this is. The chart tells me where to place the stop loss—behind this heavy
volume zone. Take profit was before this heavy volume zone. I took the take
profit right here. Looking at this retrospectively, it should have been
somewhere in here—closer to the weekly VWAP, closer to this volume peak—but I
was asleep at that time when it hit the take profit. I wasn’t able to manage
the position actively. So, when I sleep, I just prefer to be safe than sorry.
That’s why I took the take profit in here. Again, it would’ve been better to
take it here, but it was close anyway. It was before a potential support. The
price did not react to that support—sellers just dominated the market and went
past it—but still, this was a good place to quit the trade.
Again,
the market shows the place—not the pip count. I don’t really care how many pips
this is. What matters is that the take profit was in a logical place based on
this potential support.
All
right, those are the trades I took earlier today. Let me show you one more.
This is a trade that hasn’t played out yet. It’s a trade I plan to take on AUD/USD.
The level I want to trade is this support at 0.6295, based on this rejection of
lower prices—a strong rejection where buyers aggressively took over. If you use
the Volume Profile like this to see how the volumes are distributed in that
rejection, then you can see there was this heavy volume zone right here.
Again,
I’m not really counting pips. I know that I want to place my stop below this
heavy volume zone and behind this little swing point. So, the stop will be in
here—no matter how many pips that is. That’s the cool thing about this
strategy: you don’t need to adjust your fixed take profit and stop loss every
time the volatility changes. You just look at the chart, set the stop loss and
take profit according to the chart, and that’s it.
Now,
this is the stop loss. Regarding the take profit—I simply don’t know where it
will be, because I’ll want to place it based on how the volumes look in this
area where the price makes the pullback. So, I need to see how the volumes are
distributed in here, and I’ll place my take profit according to that. At least,
it should be somewhere in here—but ideally bigger than a 1:1 risk-reward ratio.
I
hope that this approach makes sense and that you like it. By the way, those
levels I’m showing you—those are levels from the members area. I’m publishing
those levels every day. Let me show you real quick. So, here is our backend.
This is a table I published yesterday. This is the level on USD/CHF
which I was showing you. The level on USD/CAD was from yesterday’s
prediction—this one.
If
you guys want to join us, then go to my website: www.trader-dale.com. This is it. Click
the button “Trading Course
and Tools” Currently, I’m running a sale on my best educational and
indicator packs. These are the Volume Profile Pack, Order Flow Pack, VWAP Pack,
and Smart Money Pack. You can get them separately here, or if you scroll down a
bit, then you can get all those packs together for a discounted price.
All right, that’s about it. Thanks for watching the video. I hope you found it useful, and I’ll be looking forward to seeing you next time. Until then, happy trading!