
Do you want ME to help YOU with your trading?
Video Transcript:
Hey guys, in this video, I’ll show
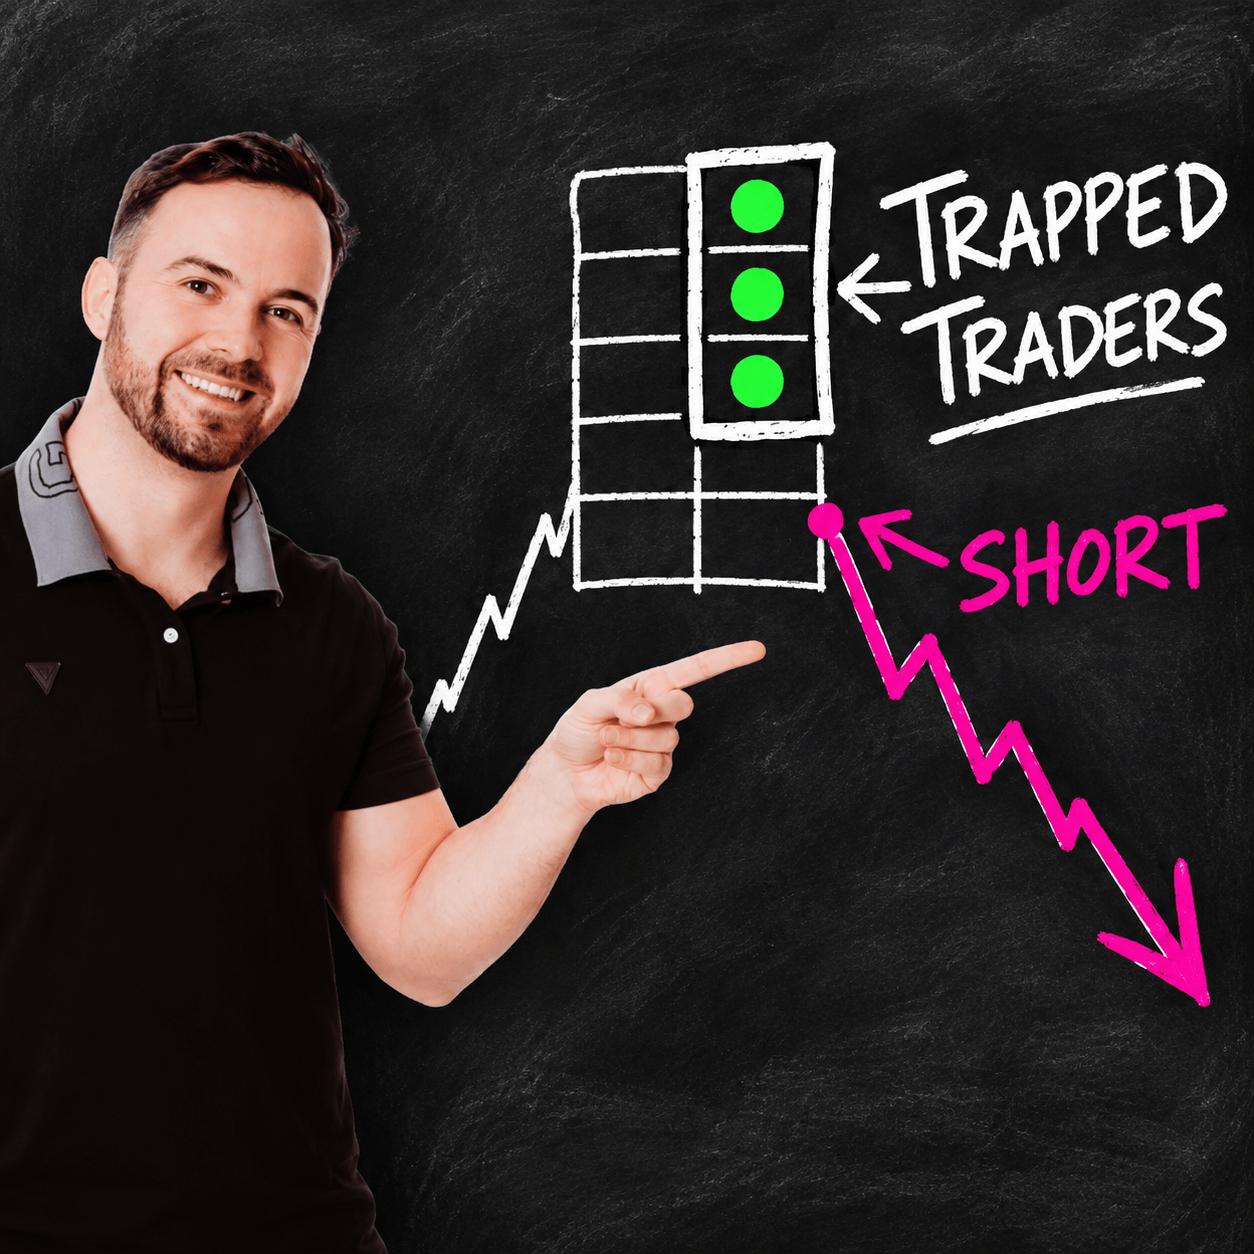
you an Order Flow setup called Trapped Traders. First, I’ll do a little drawing
so you guys can understand the concept, and then I’ll show you a real trade
that I took recently.
So let’s start with a little drawing
of the trapped traders. Imagine a short trade scenario. First, the price goes
up like this, and then there’s a footprint on the Order Flow that shows strong
buying activity in those cells close to the high. That means heavy volumes
here, here, and here at the ask, right? Normally, that would scream at you that
buyers, aggressive buyers, are pushing the price upwards and that the price
should continue going up. But if the price does not follow through, if instead
it starts to drop, then those guys are called trapped traders. In this case,
trapped buyers, because they got trapped in their long positions. They weren’t
able to push the price higher even though they were buying aggressively. They
weren’t able to follow through, but instead they failed. They are trapped here,
and the price drops down. And because those buyers failed, this gives us
important information about the sellers: the sellers are in control and the
sellers are stronger than those buyers here. For that reason, the price should
go down.
This is the concept of the trapped
traders. Okay, just a quick recap. First, there needs to be a clear signal of
strong buyers pushing the price up, but they need to fail and the price needs
to reverse. That’s it. That’s the whole concept. Okay? When you see this, when
you see that they failed and that the price is reversing, you enter a short
trade. This is a confirmation. Okay? Trapped traders are a confirmation for
your short trade.
Now, you don’t look for this setup
anywhere on the chart. You need to see this around a strong support or
resistance zone. It’s up to you which tool you use for identifying strong
support or resistance zones. I personally like to use Volume Profile. And the
way it should work is like this. Imagine that we have a strong resistance
somewhere in here. It could be Volume Profile-based resistance or any other
resistance based on, let’s say, Smart Money Concepts, Fibonacci, or whatever.
But there needs to be a resistance area. When the price reaches that
resistance, then there needs to be that confirmation of those trapped traders
in that resistance zone, not just anywhere on the chart. Because if you spot
this anywhere on the chart, it’s just noise. It doesn’t mean a thing. It’s only
a good confirmation if it comes inside a strong resistance. Okay?
So this is a short trade scenario.
The long trade scenario is the same thing. It’s only reversed. So that would
look something like this. The price is dropping, and then at the bottom there
is a footprint where you have strong sellers at the bottom of this footprint.
But instead of the price continuing to drop lower, it reverses and goes
upwards. Okay? If you spot this around a strong support zone, let’s say that
this is the support zone, if you spot this around the support, then it’s a
signal for you to enter a long trade.
Okay, so that’s the concept. Let’s
now check out the trade that I had. As I said, it’s important that you don’t
just look for this signal anywhere on the chart, but you need to spot
significant support or resistance. In this case, I was trading Euro futures.
And here on this 30-minute chart, the price was dropping. And when the price is
dropping, I’m looking for significant volume clusters within that trend. So I
wanted to trade this volume cluster because it was strong and it was standing
out. As the price was dropping here, what I wanted to do was wait for the
pullback and trade from there, from the beginning of the volume cluster. This
is, by the way, also a trade that I called in advance for members of our
trading course. But yeah, this is how the big picture looked. Okay? This was
the level that I was looking to trade.
Now, what I’ll do is switch over to
the 30-minute Order Flow chart, this one right here. And I want to show you how
this level looked on this 30-minute chart before we jump into the setup itself.
Okay? Because there’s one interesting thing here. So this is essentially the
zone where the heavy volumes were formed. You can clearly spot this because the
Order Flow is in darker shades of gray. That means that heavier-than-standard
volumes were traded here in those areas. Also, the high-volume nodes in those
three footprints were at the same level. That’s why they are highlighted in
yellow. My software does it. See, if they are next to each other like those
three, they’re highlighted in yellow. That’s important because if they are at
the same price, then that means that this is a strong level.
But I wasn’t trading exactly from the
level. What I prefer is trading from the beginning of the heavy-volume zone,
which was in here. This is this blue line that you can see here. Okay? So this
was the downtrend, this was the pullback, and this is where the price hit my
level. This was the level. Okay?
And now back to the Trapped Traders
concept. And for that, I need to switch over to the five-minute footprint
chart. Normally, I have this on multiple screens, but since you can only see
one screen, I need to switch between those here. Anyways, this is a bid x ask
footprint chart. By the way, I’m not sure I mentioned the platform before, but
this is NinjaTrader 8, and here is how the price went up towards that level.
This was the resistance level. Okay? And here I was waiting for some kind of
confirmation.
Now, what I saw here were these heavy
volumes, actually imbalances. One, two, three imbalances at the ask. What an
imbalance means is that buyers are three or more times stronger than sellers.
You always compare imbalances diagonally like this. Okay? So you compare 16 to
50, compare 33 to 141, and compare 0 to 32. If the number on the right is three
times bigger than the number on the left, then it’s called an imbalance, and it
means one side of the market is more aggressive than the other one. In this case,
it’s buyers because it’s on the ask. Okay? In this case, buyers are dominant.
So we are getting back to what I was
showing you before. This is screaming at you that since buyers are dominant in
those three places, the price should go up. But what it does instead is drop in
the next footprint. And these are trapped traders, right? Those guys are
trapped. Strong buyers who were supposed to push the price up, but they failed
because sellers were stronger. They are trapped. They are trapped traders, and
when this footprint closes, you have your confirmation to enter the short.
Okay? These are trapped traders. Those guys are trapped traders.
What’s important is that there are
those imbalances. My software highlights those in blue so I can spot them
easily. And it’s important that they are stacked next to each other. One, two,
three. And very, very close to the high of this footprint. Okay? That’s
important: that they are close to the high, that there are imbalances, and that
those imbalances are stacked.
The next thing you want to see is the
next footprint closing like this, negative and below this one. Okay? Also, one
thing to notice is, check out the delta here in this footprint where the
imbalances occurred. We have delta around zero. But the next footprint has
strongly negative delta. That means sellers are jumping in. Strong sellers are
jumping in, and the sellers are stronger than buyers, right? That’s why we have
negative delta. So that’s one more confirmation for you. Usually, it’s like
this. When the price turns like this, the delta should turn as well. Okay?
So all this is painting a pretty
clear picture of what was going on at this resistance, which I marked on my
chart and found using Volume Profile. When the price reached that resistance,
buyers tried to push through, but they failed. They got trapped. The sellers
took over, and boom, short. Okay?
So this is a typical case of what
trapped traders could look like. Remember, for the short trade scenario like
this one, you need to see heavy buying at the ask close to the high, ideally
stacked imbalances, and then the price needs to turn, trapping those buyers
there. I mean, they are not really trapped there. They can quit their positions
anytime. But traders like to call those trapped traders, so that’s why I’m
sticking to this terminology and calling them trapped traders as well.
Okay, so this was the short trade
scenario. The long trade scenario would look basically the same, only
everything would be reversed. We would be going long from a support, and we
would be looking for imbalances close to the low, and those imbalances would be
on the bid side of the footprint.
So that’s about it, guys. I hope you
found it useful. If you want to learn my whole Order Flow strategy from A to Z
and also get your hands on my custom-made Order Flow tools, then I recommend
visiting my website. It’s at trader-dale.com.
And if you click this button that says “Trading
Course and Tools” then it’ll bring you straight to the page where you can
get my Order Flow course and my Order Flow indicators.
All right, so thanks for watching,
and see you next time. Until then, happy trading.
