
Do you want ME to help YOU with your trading?
Video Transcript:
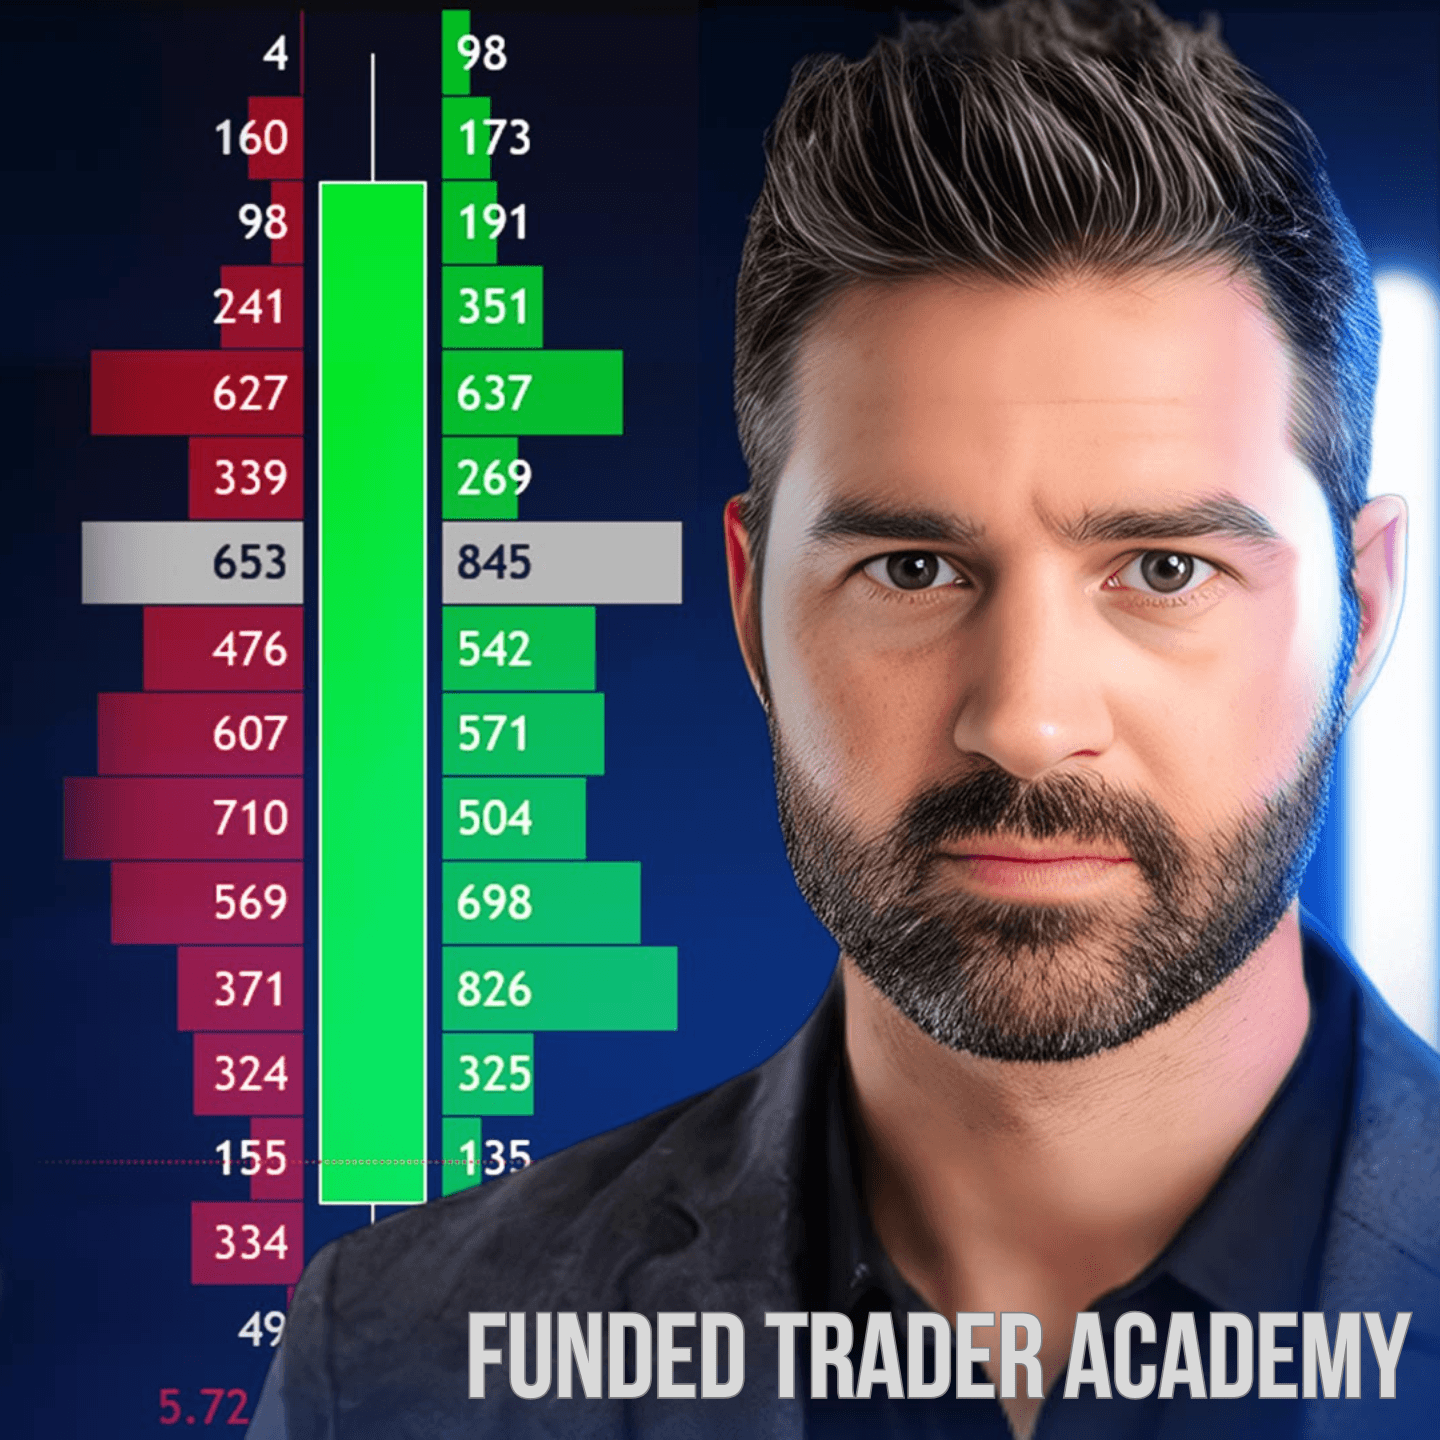
All right, welcome. Dan from Funded Trader Academy here. We’re going to take a look at this almost 50-point short here on the NQ. We’re going to take a look at this thing top to bottom using the DeltaFlow Order Flow indicator here to show this breakdown of the Initial Balance low. But before we do that, we’re going to start off from a higher timeframe and really kind of give some context.
So, if we look at the broader market, this leg down here is dominated by bearish Order Flow on the way down. Okay, slight little pop up here on Friday pre-market, and then a gap down to start Monday right into consolidation. So, we are pushing prices down towards that 7,600 level. During the overnight session, price dipped during the Asian session, dipped further in the London session, and took out the prior week’s low and prior day’s low before a bounce.
So, heading into the cash open, the question becomes: are we going to expand further to the upside, take out that prior day high, or are we going to fail further and move down towards that London low? Okay, so as we set up for the market, for that opening bell, we craft out a few scenarios. If the initial impulse move of the market is up, we’re going to look for one of two scenarios. We’re going to look for a displacing move to the upside with a pullback, possibly to push to higher price points. We’re also going to look for an initial impulse move up followed by rejection and failure signatures to move and rotate back down through the value area.
Okay, if the initial impulse move is down, we’re going to look for price to dip, offer us a failed breakdown, and rally back to some of these highs. If the initial impulse move is down, we’re also going to look for a displacing move on the way down, look for a pullback, and then a push to lower prices. Okay, those are the four scenarios. I’m going to go ahead and paint these two in green for the bullish scenarios, but we’re really going to look at how the market opens and that initial impulse move, which typically requires that first 15, 20, or 30 minutes of the market to really give us an idea of what that initial impulse move is. Okay? So, if we’re going up, we’re looking for one of these two scenarios. If the initial impulse move is down, we’re going to look for one of these two scenarios.
Okay, so let’s go through that opening candle. This is on an hourly chart, so we’ll just click one candle forward and take a peek. Okay, the initial move off the open, the initial impulse move in that first 30 minutes, is down decisively. Okay, so let’s go to our chart.
All right, we’re looking at that right here on both ES, the S&P 500, and NQ. Okay, so the initial impulse move was down decisively. We also then had the Initial Balance set during that first hour of market activity. Okay, decisively, prices are down. The initial impulse move is down. So, when we’re down here, we’re looking for a displacing move that price pulls back into and then delivers to lower prices.
Okay, so right here, once we breached, once we displaced through right at this candle here, from 9:37 down to 9:40, it created a five-minute imbalance in here, a bearish imbalance right at the lows. Price pulled back into it with very, very weak and almost nonexistent bullish flow, tapped it, and pushed right to that Initial Balance low. It failed, and then the bears came in decisively. Okay, this is where we entered.
If we go ahead and plot that out here, you can see that we ripped through and created more bearish flow all the way down, disrespecting bullish flow all the way down for that bearish sentiment. Price displaced right through here, created this little imbalance right here for price to pull back into, tap, and fail, delivering almost a 50-point trade on the NQ.
So, let’s go back and recap that real quick. We took a look at the overall broader market. It was decisively down. We moved and shifted into consolidation to kick off the week. We had our gap down into consolidation. We tried to seek higher prices on Monday. That failed during the overnight session, creating a potential failed breakdown situation here.
Heading into the open, we took out some key levels of liquidity. Price popped, did not hold, did not extend, and did not expand further. Instead, we had the inverse happen. We prepared for both sides of the market. We prepared for an initial impulse move up and an initial impulse move down. The initial impulse move was down, and we got our key and clear light-bulb signal that we had displacement lower and a pullback with a setup.
Okay, I hope that was helpful. We’ll catch you guys over on the next video.
Hey everyone, it’s Dale here. I hope you enjoyed the video. If you’d like to trade alongside me and our team of prop firm funded traders every day, then click the link below the video and hop aboard. We’re looking forward to trading with you.
