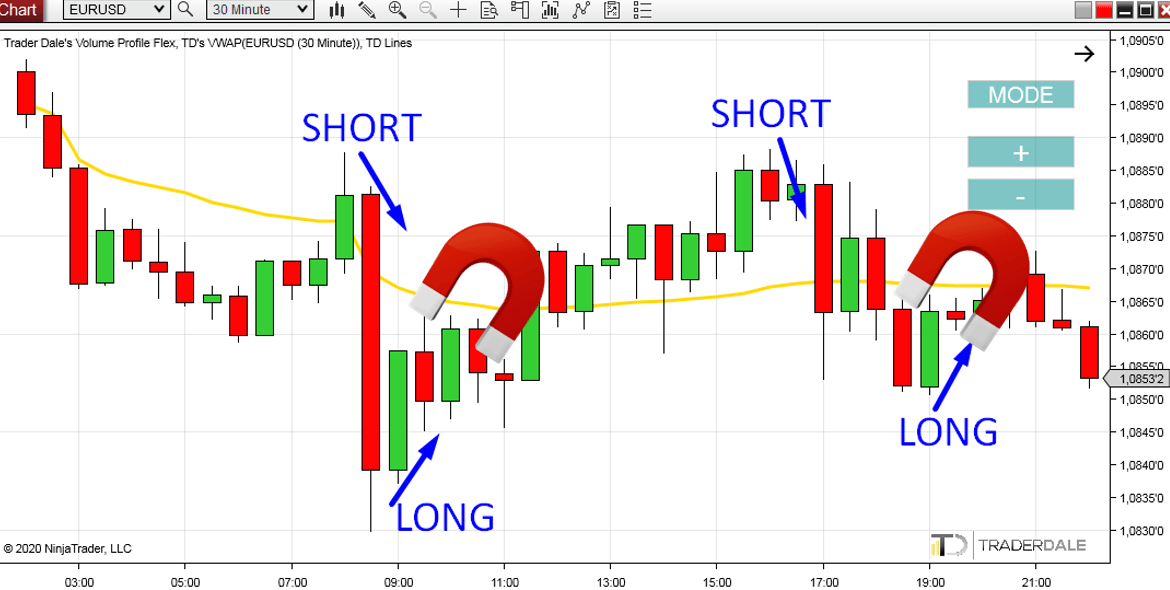
In today’s video, our Head Trader Dan breaks down his latest 22-point ES trade from June 29, 2026.
This was a clean example of how to prepare before the market opens, map out possible scenarios, wait for price to reach your area, and then use Order Flow confirmation to enter the trade.
In this video, you will learn:
✅ How to frame the trading day before the market opens.
✅ How to use higher-timeframe imbalances to build trade scenarios
✅ How trapped sellers helped confirm the reversal
✅ How delta shift and break of structure confirmed the long entry
🎥 Watch it here:
www.trader-dale.com/how-to-trade-reversals-using-imbalances-and-order-flow-1st-jun-26/
P.S. Want to trade like a pro and finally get funded? Our 🎓 Funded Trader Academy gives you direct access to our team of experienced prop traders, personal mentorship, and a proven road map to secure funding.
Click the link below to see how it works:
👉 trader-dale.com/funded-trader-academy
... See MoreSee Less
23 hours ago
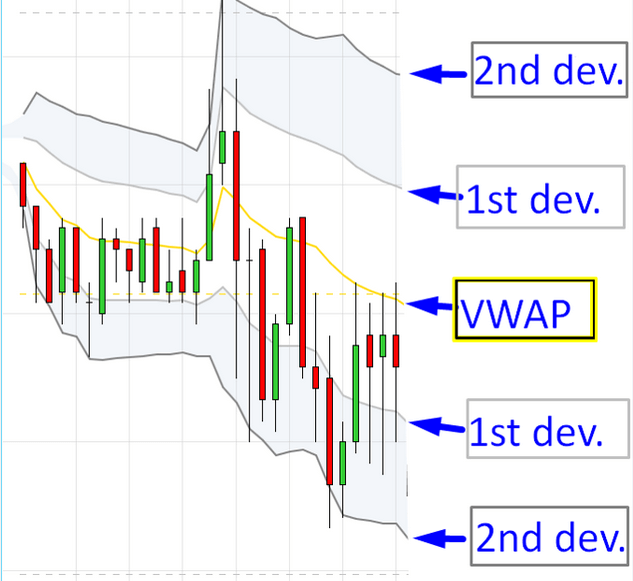
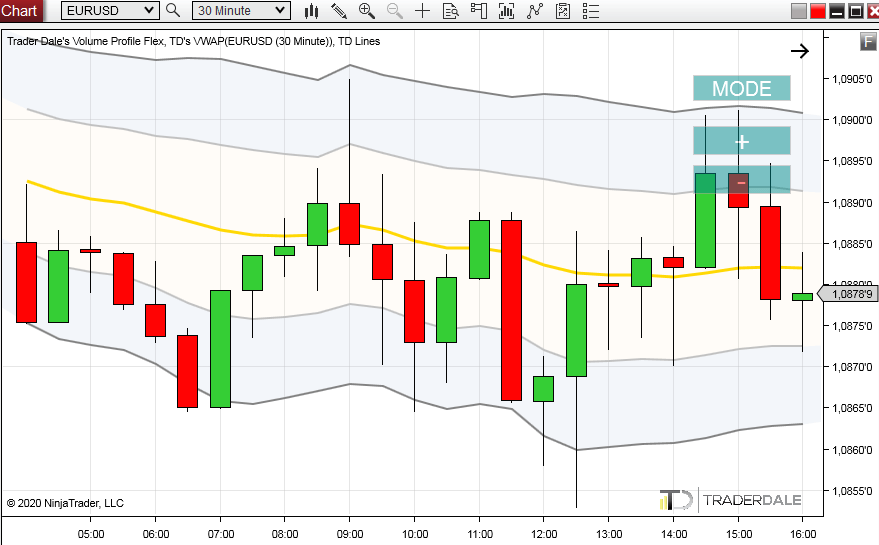
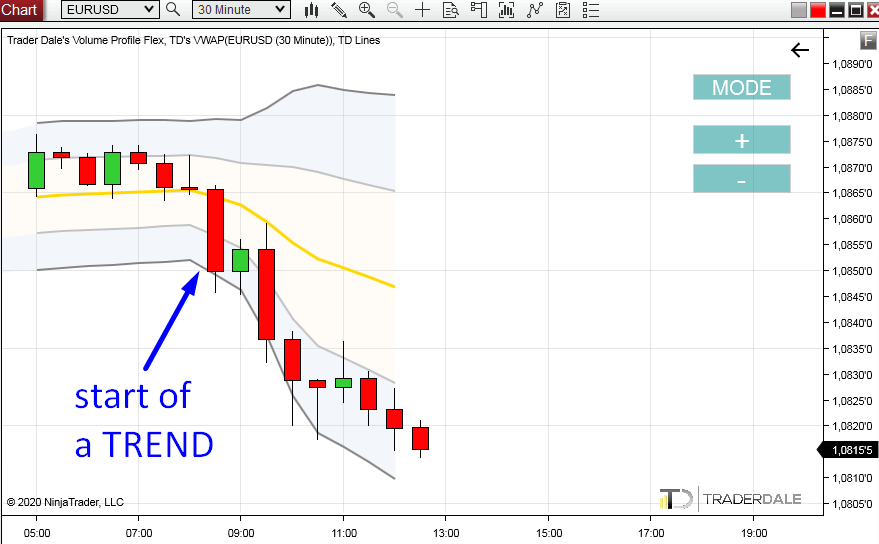
In today’s video, I’ll show you a simple Order Flow Pullback Strategy where we find important volume zones and use them for pullback entries.
The idea is simple:
💡Find a strong volume cluster inside a trend or rejection.
💡Mark the beginning of that zone, and then wait for price to pull back to it.
💡When price returns to that area, you trade in the direction of the original move.
In this video, you will learn:
✅ how to find important volume clusters with Order Flow
✅ why these zones often work as support and resistance
✅ how to trade pullbacks from heavy volume areas
✅ how to use this setup in both trends and rejections
👉 You can watch the full video here:
www.trader-dale.com/order-flow-pullback-strategy-trade-big-volume-clusters-30th-jun-26/
P.S. Ready to trade with the same powerful tools I use? Discover my top educational & indicator packs here:
www.trader-dale.com/volume-profile-forex-trading-course/
Want to trade LIVE with me and my team of prop-firm-funded traders?
Claim your free consultation call now:
www.trader-dale.com/funded-trader-academy
... See MoreSee Less
2 days ago

Hello,
I would like to ask you why is the support line on different time frames more stronger or weaker?
For example: why is the support line weaker on M5 time frame compare to the support line on H4 time frame that is more stronger
What is the reason behind this?
Thank you and have a good day!
George
Hello,
this is a really good question!
The higher time frame the more institutions trade it. The strongest trends (daily,weekly, monthly time frames) are caused by huge financial institutions and their massive capital. Faster time frames are also traded by institutions but there could be a lot of noise (algos, day traders,…) – but those don’t start and drive the strongest trends. Its the biggest guys who ride the big waves 🙂 A day trading level based on 5 Minute chart is not going to change a trend that has been there for a year, right?
Hello, I am a fan of yours. I would like to know when the course will be held. I mainly use Trading VIEW for trading.
Hi Dale,
I really like the logic behind your volume profile and vwap strategies, especially focusing on trading the point of control. Is there a reason you prefer to trade Forex using this strategy – as opposed to Nasdaq or some other indices or individual stocks? I ask because I used to trade forex – with limited success. I have passed several prop firm challenges in the past and received some payouts, but I got away from trading forex because it was just so erratic and unpredictable in my experience. Would love to hear your insight on this one!