Prefer an article? Go here: How to Predict Price Reversals Using Cumulative Delta: A Complete Guide
Do you want ME to help YOU with your trading?
Video Transcript:
Hello everyone, it’s Dale here. In
this video, I’ll show you how to use cumulative delta to spot price reversals
before the price even starts to turn. I’ll show you a couple of real trade
examples, and by the end of the video, you’ll know exactly how to implement
this into your own trading strategy, no matter what that trading strategy
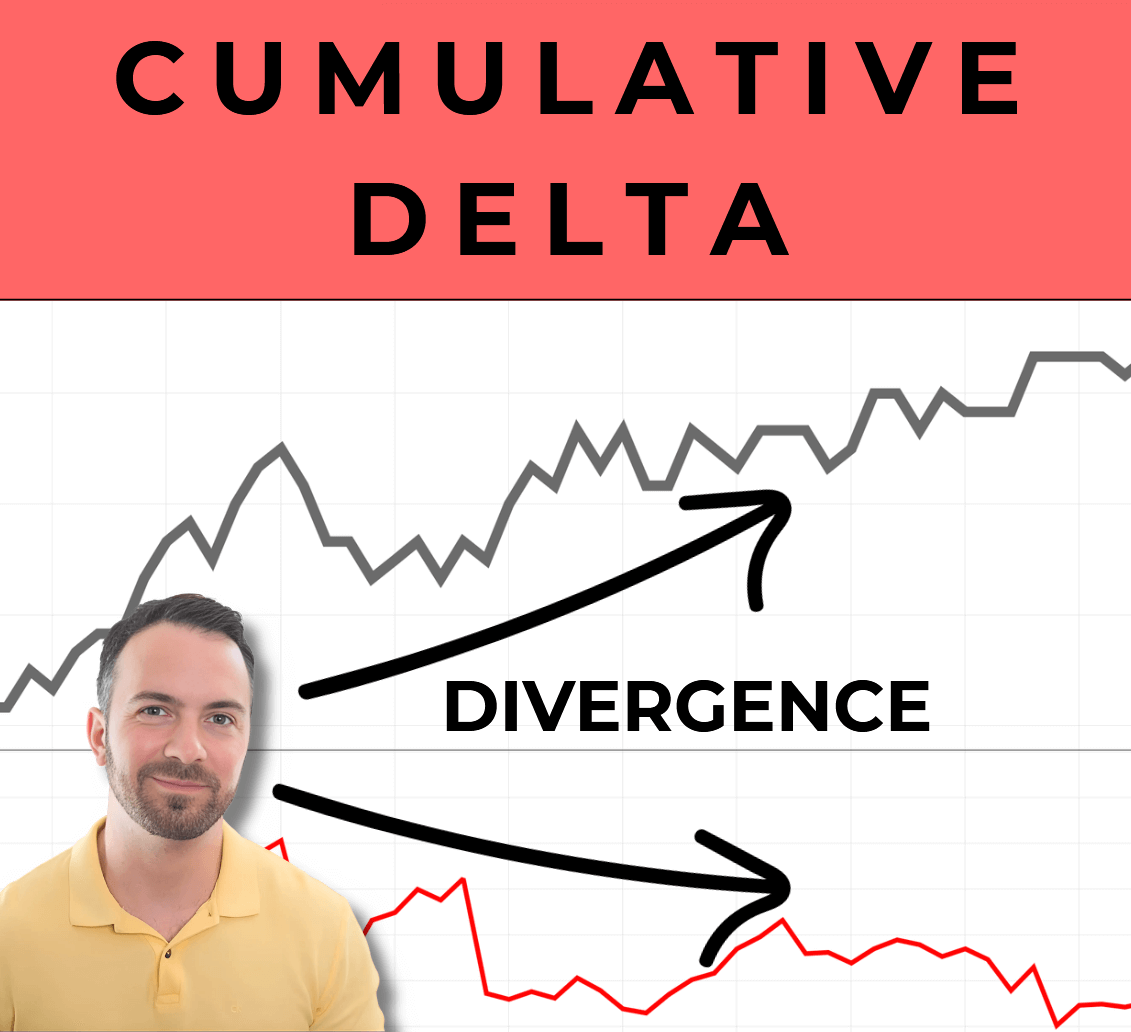
actually is. Right? So, let’s get to it. In my opinion, the best way to use the
cumulative delta is to look for divergence. What you want to see is a
comparison of the cumulative delta chart, which is this one, with the price
action chart, which is this one. You can place both charts in one trading
window. For example, in this place, this is how the price was developing and
this is the corresponding delta. It’s always right below it. All right, so the
two charts correspond. Now, what I recommend doing is using a one-minute chart.
This is a one-minute price chart right here, and below it a one-minute
cumulative delta chart. All right, one minute in here. So it’s really detailed,
and this way you can spot divergences very nicely.
Now, divergence appears when the
price is going one way, like in here, where the price was going downwards and
the cumulative delta was moving either sideways or upwards. Right? So this is
divergence because the price is going downwards and delta is going upwards. And
this is very important information the market is giving you in this example.
What it is telling you is that price was dropping, but at the same time buyers
were more aggressive than sellers, yet the price was still dropping, which is
quite unusual, isn’t it? So you look for those unusual cases where delta is
telling you something different from the price action chart. Most of the time
delta and price action move in the same direction, but there will be cases
where they don’t, and this is where you should expect the price to turn or
something to happen, like in here. What the price tends to do is follow delta.
So in here delta was rising and price was dropping. It was telling us that even
though price was dropping, buyers were more aggressive. And as you can see
later on, the price started to rise, but delta told us first, way before the
price started to turn. Delta started to rise, and that’s why I’m saying delta
is so useful, because it’s able to show us in advance what is likely going to
happen.
Now here is another example of
divergence. In this case, the price was rising, but in the same area at the
same time, cumulative delta was dropping. This was telling us that even though
the price was rising, sellers were more aggressive and they were selling. In
the end, you can see that price started to follow delta, turned, and went
downwards, but delta gave us this information in advance. So that’s how you can
use divergence with price and delta.
Now let me go over to my charts and
show you a couple of examples. Here is example number one. What you’re looking
at is Euro futures, a five-minute chart. My favorite way to find strong support
and resistance zones is using volume profile. In this video, I’m not going to
talk too much about the volume profile setup, but I’ll focus on the divergence
of cumulative delta and price. In this case, the volume profile is showing us
two strong supports based on this significant volume zone and this significant
volume zone. This is the first support and this is the second support. After
you find those supports, you need the price to return back to them to test
them. Let’s say the price is heading towards the first support and you are not
sure whether to enter a long trade or not. So you look at the cumulative delta
chart and try to spot a divergence there.
Let me open that cumulative delta
chart. This is it. This is the place of the first support. This is a one-minute
price chart and this is cumulative delta. Now let me do it like this. At the
time the price is heading towards the level, this is what you see. This is what
the price is doing on the one-minute chart, dropping towards that potential
support. At the same time, you want to look at cumulative delta. If you look at
this area and compare it to the same area on delta let me zoom it in a bit then
you can see there is a clear divergence. Even though the price is dropping,
delta is rising. This is a divergence. This is telling you that even though
price is dropping, there are more aggressive buyers. And this is the
confirmation you want to get. So when the price finally hits this support, you
go long from there because cumulative delta confirmed that a reaction is most
likely going to happen. All right, this is it. That’s the reaction almost 20
pips.
Coming to the second zone, coming to
the second support which is here. That’s support number two. The price is
heading towards that level. Delta is also dropping, so no confirmation yet. If
I move the chart a bit, then as you can see, the price is rotating at the
level, and at this time you’re also watching cumulative delta which is showing
you that aggressive buyers are in control. They are buying heavily here. The
price action chart doesn’t show you that, but cumulative delta does. So what
you do is go long from here because you just got the confirmation, and finally,
as you can see, the buyers started to drive the price up first and there was a
nice reaction to that second support. But if you didn’t have delta here, you
wouldn’t be able to tell that buyers were very active. So that’s the first
example I wanted to show you on the Euro futures.
Hey guys, I hope you are enjoying the
video. If you want to get your hands on my cumulative delta and order flow
software, you can get it along with my Order Flow trading course on my website.
It is at trader-dale.com. If you
click “Trading
Course and Tools” it will bring you to this page. Scroll down a bit and
here you can get the Order Flow pack, which includes the Order Flow education,
my exact strategy from A to Z, including Order Flow software, cumulative delta
software, and volume profile software. All right, let’s get back to the video.
Another example is on the Australian
dollar futures. Again, we are looking at a five-minute chart. As I was saying,
using volume profile strategies is not mandatory here. You can use other
strategies to find your support and resistance zones. What a lot of people do
is look at daily highs and daily lows for potential support or resistance. So
let’s check out the Australian dollar futures. We are looking at a five-minute
chart here, and right here, this was Friday, and on Friday this was the high of
the day. Let me print a line there. The high. Yeah, I know you can see there
was a nice reaction to that high. But when you are trading and the price is
approaching quickly to that significant high, that significant resistance or I
should say potential resistance you’re not sure whether the price is going to
react or not. When the price is close to that level, you want to open the
cumulative delta chart and see what’s going on. You want to see a divergence
that would tell you sellers are aggressive and likely to push the price
downwards.
So let me load up the cumulative
delta chart. This is what you see. Again, you’re looking at a one-minute chart.
This is the price chart. This is the cumulative delta chart. The potential
resistance is here. And here is the price rising towards that resistance. At
the same time, cumulative delta is not really rising. It’s going sideways. So
there is a divergence. Afterwards, delta starts to drop. This is where delta is
dropping. So this is a very nice signal this divergence on delta that sellers
are aggressive here and most likely are going to push the price downwards.
Eventually they did, because price tends to follow delta. As you can see, delta
told us that way before the price started to drop.
Now let me give you one more example,
and that example is going to be on the ES, which is futures for the S&P 500
index. In here, there is a one-minute price chart and below that a one-minute
cumulative delta chart. Imagine this scenario: price was going downwards here,
bounced, and created this strong swing low. Now imagine you are thinking about
trading from that potential support. You don’t know if this is going to work as
a support or not, but potentially this looks like a strong level because the
price bounced off it. So maybe you are thinking about trading long when the
price hits that level again. What you do is, at the place where the price hits
that support again, you look at delta. You look here and want to see some
confirmation. In this case, you would like to see rising delta because that
would tell you strong and aggressive buyers are jumping in, reacting to that
support. But in this case, there is absolutely no sign of buyers. Delta is
dropping. This is telling you not to trade this support. It’s a no-go. If delta
started to rise, it would be a confirmation and it would be a divergence
because the price was dropping. If delta was rising here, it would be a nice
divergence and a signal to go long. But price is dropping and delta is
dropping. This is telling you sellers are in control and you shouldn’t go long.
So in this case, it is a warning signal. That’s how you can tell what’s going
on who is more aggressive, buyers or sellers.
Now, what instruments to trade with
cumulative delta? I know you guys may be thinking if you can trade Forex with
it. Unfortunately, Forex is decentralized and it doesn’t provide bid and ask
data. So unfortunately you can’t use cumulative delta for Forex. But you can
use it for all futures markets because futures are centralized and they provide
bid and ask data. You can use it for all kinds of futures: currency futures,
indexes, crypto futures, gold, oil anything you can find. But unfortunately for
Forex this doesn’t work, because Forex simply doesn’t provide you with bid and
ask data, which are crucial for cumulative delta.
helle my name is steeve i want to start how to become a trader