Prefer an article? Go here: How to Read Volume Profile Shapes: What the Market Is Really Telling You
Do you want ME to help YOU with your trading?
Video Transcript:
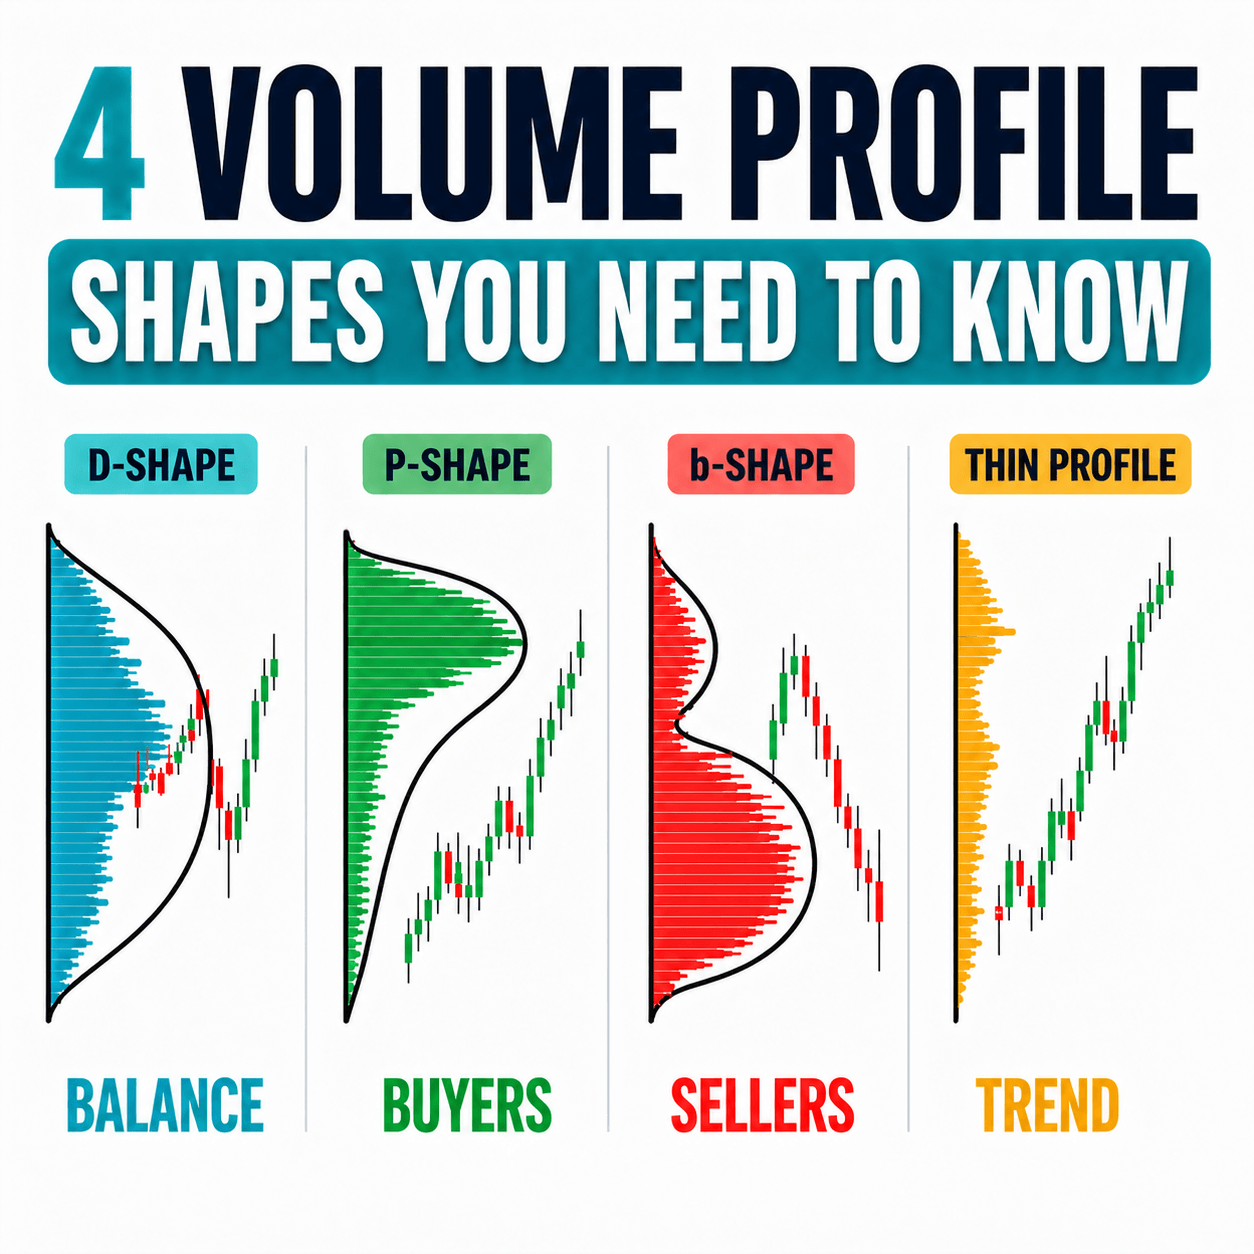
In this video, I’ll show you how to decode the market using four Volume Profile shapes. Each shape tells you what buyers and sellers are doing, which is exactly the insight you need to plan your trades and gain an edge. So, let’s get to it. These are the four main shapes. We have the D-shaped profile, which looks like a capital letter D. Then there is the B-shaped profile, which looks like the letter B. The P-shaped profile, which looks like the letter P. And then there’s the thin profile, which is simply a thin profile.
Let me start with the D-shaped profile. This is how it looks. As I was saying, it looks like a capital letter D. The most important place in this profile is the point of control, which is usually somewhere around the middle. This shape of Volume Profile is by far the most common one. The reason is that it forms when the market is going sideways. When the market goes sideways, there is usually a D-shaped profile. Markets go sideways around 70% of the time. Most of the time, markets move sideways, and for that reason, the most common profile is the D-shaped profile. What it tells us about the market is that the market is balanced. If you look at this example here, you can spot D-shaped profiles. Not all of them are perfect letter D shapes, but as you can see, they formed during sideways price action and tell us that the market was balanced in that area. Everyone trading there was more or less comfortable buying and selling in that zone.
There is also another thing the D-shaped profile can tell us, and that is the end or a pause of a trend. If you look at this example, the price was moving upwards in an uptrend, and then there was a D-shaped profile. That means balance. Before that, the price was not balanced because it was rising. But then buyers and sellers became comfortable trading in that area, so the market became balanced. That could mean either the end of the trend or just a pause in the trend.
Now let’s talk about the P-shaped profile. The P-shaped profile looks like the letter P, which means it has heavy volumes at the top and low volumes at the bottom. There are two ways it can form. One is when there is a strong rejection of lower prices. That means the price drops and then shoots upwards again. The second way is during an uptrend. In both cases, the Volume Profile looks like a letter P, and it tells us one thing about the market — buyers are in control. So when you see a P-shaped profile, you should read it as buyers taking over.
The P-shaped profile can tell us two things about the market. First, that the market is in an uptrend. As you can see, we have an uptrend with several P-shaped profiles. The second thing it can tell us is that it may signal the end of a downtrend. If the price was dropping and then forms a P-shaped profile, it shows that buyers stepped in. That means the downtrend could be over, or at least paused.
By the way, these profiles are daily profiles. Every day, a new profile is automatically printed on the chart, so we are looking at daily profiles. One important thing about the P-shaped profile is that it is only valid when the price closes above 50% of the daily range. If the price closes below that level, even if it visually looks like a P-shape, it is not a proper P-shaped profile and does not signal buyers in control.
Now let’s talk about the B-shaped profile. This one is easy because it is the opposite of the P-shaped profile. The B-shaped profile can form in two ways. One is when there is a rejection of higher prices and the market moves downwards. The other is when the price opens, drops, and then builds volume along the way. Both scenarios create a B-shaped profile.
The B-shaped profile tells us two things about the market. First, that there is a downtrend. You can see multiple B-shaped profiles during a downtrend. The second thing it can signal is the end of an uptrend. If the price is rising and then forms a B-shaped profile, it means sellers stepped in, and the uptrend is likely over or at least paused.
There is also an important rule for the B-shaped profile. It is only valid when the price closes below 50% of the daily range. If it closes above that level, even if it looks like a B-shape, it is not a proper B-shaped profile.
The last one is the thin profile. The thin profile usually forms during a strong trend, often caused by major macro news or strong momentum. It does not have a single heavy volume zone. Instead, it is relatively thin with a few smaller volume clusters. This happens because when the price moves quickly, large institutional traders do not have enough time to place their large orders. That is why the profile appears thin.
What the thin profile tells us is simple — there is a strong and aggressive trend. Either buyers are pushing the price up aggressively, or sellers are pushing it down. One side of the market is clearly dominating.
Let me quickly recap. The D-shaped profile means balance. The P-shaped profile means buyers. The B-shaped profile means sellers. And the thin profile means a strong trend.
Alright guys, I hope you enjoyed the video. If you want to learn more about Volume Profile trading and get my strategy from A to Z, including the custom indicators I personally use, then head over to my website trader-dale.com. Scroll down and you can get one of my trading packs. Thanks for watching, and I’ll see you next time. Until then, happy trading.