
Do you want ME to help YOU with your trading?
Video Transcript:
I want to show you how you can track
the big players and trade alongside them rather than against them. What you see
here is the TradingView platform, and I want to demonstrate this using a trade
from yesterday. I use my custom-made software, which is called Big Players
Radar. I just released this software, and I’m using it to track the big
players. Here’s how I used it in yesterday’s trade and how you can use it as
well.
So, here is a 30-minute chart of the
ES. The first thing, and the most important thing here that the whole trade is
based on, is that if you take a look at the Volume Profile here, then right
here, this is the weekly Point of Control. That’s the most important level from
the whole week. This is the weekly Point of Control right here. Those heavy
volumes that you see here were formed and traded in this area. This is where
the weekly Point of Control formed.
Black Friday pricing on the Volume Profile pack and the other 3 indicator packs. Ends Nov 30.
What happened next was that the price
moved away from that weekly Point of Control. The weekly Point of Control is
usually a strong level to trade from. Okay, so then I was waiting for a
pullback to that level, and I wanted to see some kind of confirmation that the
big players were jumping in at this point.
This level was based on the weekly
Point of Control, but that wasn’t all. It was also based on two more things.
One thing is that the price was reacting here and here. That means that this
zone was a strong support level. And when the price went past the support, it
turned into resistance, right? So, that’s the weekly Point of Control plus this
price action setup. Both are pointing to this zone.
Another thing is that when the price
was dropping right here, there were those two red dots. That’s what the Big
Players Radar is showing, and it means strong sellers were pushing the price
downwards. So, strong sellers were active here.
So, we now have three things, right?
The weekly Point of Control, the support-to-resistance flip setup, and those
strong sellers jumping in here. Everything is happening around this zone. For
those reasons, I wanted to trade this, but I wanted to see some kind of
confirmation that the big players also saw this zone and that they were going
to react there.
So, let’s take a look at what
happened there. When the price was making the pullback towards that level,
there were some buyers jumping in. Those are the green bubbles. That’s normal.
When the price is rising, it’s normal for buyers to join the game here.
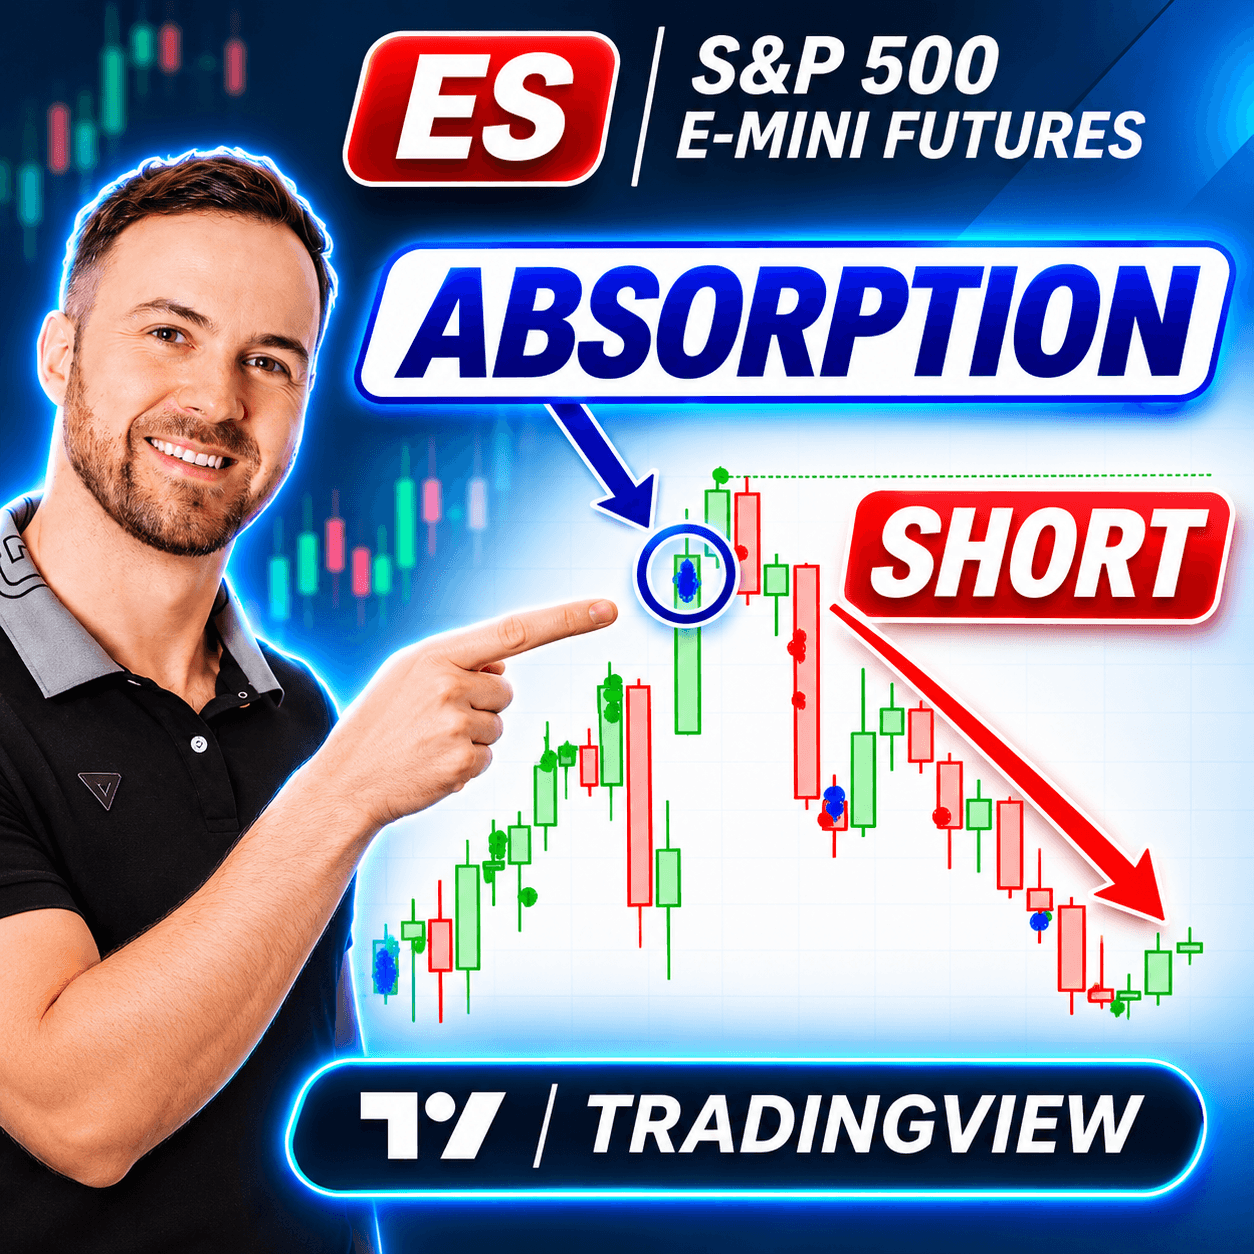
And what was important here, the
crucial thing that confirmed the short trade from this zone, was these blue
bubbles. The indicator prints those when there’s absorption. Absorption means
strong buyers and strong sellers appear at this price level. What that means is
that buyers are pushing the price up, but at the same time, sellers are
selling. And when the software spots that, it prints a blue bubble here, and it
tells you that the market is absorbing the buying pressure, right?
That’s important, and that’s the
confirmation to jump into the trade because you can see that the market is
absorbing the buying pressure at that resistance level, right? It’s important
that this happens around this resistance level, around this weekly Point of
Control, and around all those things that we identified here because if it
happened anywhere else on the chart, it wouldn’t really be that important. It
could just be noise. But when it happens around such a strong zone, it is a
confirmation for you to jump into a trade. In this case, a short trade.
Okay, there was one more confirmation
here, and it was those red bubbles here, those red dots showing strong sellers
jumping in. It’s usually like this: first, there is absorption, and second,
sellers start to jump in. So, first, the market absorbs the pressure, then one
side wins, and it shows up a bit later, like here. First, absorption, then the
sellers.
So, if after the absorption showed up
here, you still weren’t sure whether to jump into this trade or not, then the
second confirmation was the sellers here. And this was like the final
confirmation to jump into that trade.
For me, because I’m a bit more
aggressive with my trade entries, the first confirmation is enough, and then I
jump in. So, after the absorption, I enter the short trade.
So, yeah, this is how you can track
the big players using the Big Players Radar. It’s very simple to use. It simply
brings the most important data from Order Flow and prints it on a simple price
action chart like this, showing you the activity of the big players. And this
is how it looks and how you can use it.
If you want to get your hands on it,
then you can visit my website, which is Trader-Dale.com.
If you click the Course
and Tools button, it will take you to our page. Currently, we are running a
special Black Friday sale, and you can get my custom-made indicators and
education packs here at a discounted price.
If you want the Big Players Radar,
you need to get the Order Flow Pack here. You can get those packs separately,
or you can scroll down a bit and take advantage of the special Black Friday
deal, where you can get all four packs together at one discounted price,
including the Big Players Radar, which allows you to track the big players.
All right, so thanks for watching the
video. I hope you guys found it useful and interesting, and I’ll see you
around. A bientôt!
Black Friday pricing on the Volume Profile pack and the other 3 indicator packs. Ends Nov 30.