Video Transcript:
Hello
everyone, it’s Dale here. Welcome to a new video from the Recent Trade series.
The goal of this series is to show you how I apply the strategies and setups I
demonstrate in my other YouTube videos and in my Volume Profile course—and how
I use them in real trading conditions with real trades.
Today,
I’m going to show you four trades I took overnight. I placed all of them using
limit orders, and I’ll walk you through everything: the reasoning behind the
levels, stop-loss and take-profit placements, how each trade went—everything.
Let
me start with a trade on EUR/USD. What you see before you is the
NinjaTrader 8 platform with my custom-made Volume Profile and VWAP indicators.
This is the 30-minute chart of EUR/USD, and the level I traded from was 1.1522.
The reason I picked this level was due to a significant volume cluster that
formed within a trend. This was the volume cluster, and this was the trend.
When you see a volume cluster within a trend, it tells you that big players
were adding to their long positions at that price, then pushing the market even
higher. This heavy volume zone becomes a support zone. That’s the logic behind
this setup, which I call the Trend Setup. I use it when there’s a clear trend.
That’s
why I placed the level here. There was a pullback, and I entered with a limit
order because I was asleep at the time. This was the reaction. The stop-loss
was placed below the wick of this candle and behind the heavy volume zone, as I
always place my stop-losses behind such zones. The rule I use for take-profit
placement is that the take-profit goes just before the next heavy volume zone.
Now,
what I was interested in was the area where price was approaching my support.
The first significant volume cluster in the way of that reaction was this one,
so I placed the take-profit right there. That’s the same approach I repeat with
all my setups: the stop-loss goes behind the heavy volume zone, and the
take-profit goes just before it.
That
was the trade on EUR/USD. The next one was on USD/CAD. This is
the 30-minute chart of USD/CAD. Truth be told, I was lucky with this
one. But first, let me show you the reasoning behind the trade. There were
actually two reasons to enter at this level.
The
first was the same Trend Setup as with the EUR/USD trade—a volume
cluster formed within a trend. However, this alone wouldn’t be enough, because
there were stronger volume clusters within the trend. What made this one
special was a confluence with another setup: price had previously reacted to
this area, meaning it had acted as support. When the price dropped through it,
it became resistance. So we had both a volume-based and a price-action-based
reason to take a short from this level.
Now,
the reason I say I was lucky with this one is because there was actually a
reaction just before the level—about 0.7 pips sooner. If I had been at my
computer, I would have discarded the trade after seeing that initial reaction,
because I only trade first reactions. The chances of a second reaction are
smaller. But since I was asleep and using limit orders, I took the trade
automatically. When I got to my computer, I had already taken profit, which
happened around the area of the first deviation of the weekly VWAP.
As
for the stop-loss, it was placed behind the heavy volume zone the level was
based on—roughly 10 pips away. The take-profit was placed in line with my rule
that the minimum acceptable risk-to-reward ratio must be 1:1 or better.
That
was the USD/CAD trade. Again, if I had been watching live, I would have
skipped it due to that early reaction, but it worked out—so yes, a bit of a
lucky win.
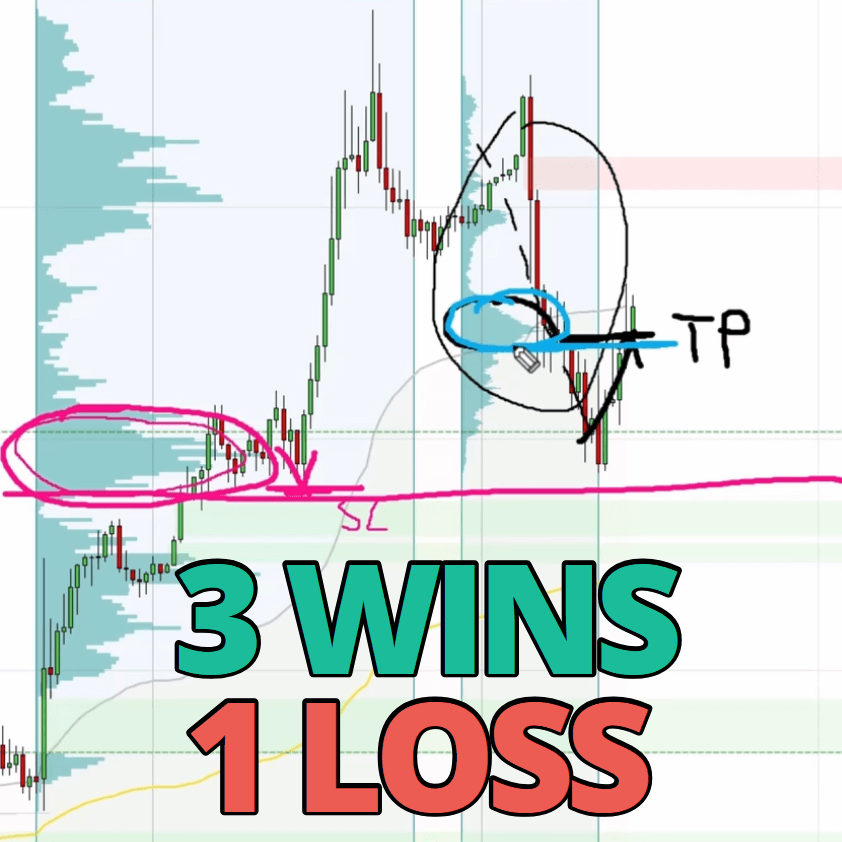
The
next trade was on the ES. This is the 30-minute chart of ES
futures. Let me show you the level first. If you remember, on Monday I sent out
a video where I mentioned this level and the reasoning behind it: a volume
cluster followed by strong buying activity. I said the volume cluster wasn’t
particularly strong, but given the strength of the buying that followed, I was
willing to take the trade.
Now,
looking at the 30-minute chart, it seems like this trade was a loser, because
price just shot through the level. But it actually wasn’t. Let me show you on
the one-minute chart. Here it is—same level, but now you can see that price did
hit the level and made a very quick, precise reaction to it. I was able to take
profit right there.
Also,
this is the S&P 500 futures. On my IC Markets platform, I don’t have access
to futures; I trade the CFD equivalent instead. These instruments weren’t 100%
correlated at the time, so I actually got an even better entry on the CFD
version. Here’s a screenshot from CTrader—the instrument is called US500, and
this is how the trade looked. You can see I was able to catch the bottom of
that reaction.
I
must admit, the sell-off on ES looked terrible. If I had been at my computer, I
probably would have skipped the trade. But since I was asleep and had a limit
order set, I took the trade—and it was a winner.
There’s
one more trade I took, on the NQ. This one was a losing trade. It was
based on the same logic as the ES trade—a volume cluster followed by
strong buying activity. I also shared this level on Monday in my Weekly Trading
Ideas video. The level was at 21,685. In this case, the price just shot
past the level with no reaction, so this trade was a loser. This all happened
during the Asian session, which was quite wild and volatile.
To
sum up, I had three winning trades and one loser. All of them had a positive
risk-to-reward ratio, so overall, a good start to the day and a strong end to
the week.
By
the way, the levels I show you in these videos are the exact same levels I
publish every day for members of my trading course. These aren’t cherry-picked
trades to brag about—they’re real levels my members see in advance.
Here’s
a quick look inside the members’ area. This is where I post the daily levels.
The levels I just showed you were: the long on EUR/USD, the short on USD/CAD,
the long on ES, and the long on NQ. Everything is published in
this table, and members can trade those levels alongside me with full
transparency.
If
you’d like to join us and trade with us, go to my website—Trader-Dale.com. Click the “Trading
Course and Tools” button. It will take you to a page where you can
choose one of my educational and indicator packs. There’s the Volume Profile
Pack, the Order Flow Pack, the VWAP Pack, and the Smart Money Pack. You can get
them individually or scroll down to get all four together in one discounted
bundle.
If
you’re interested in trading live with me and other professional traders every
day, then click the “FTA”
button. FTA stands for Funded Trader Academy. There’s a video that explains
everything about it, and if you’re interested, you can book a one-on-one call
with us. We’ll walk you through the program and help you decide if it’s a good
fit.
Thanks
for watching, have a great weekend, and I’ll see you next time. Until then,
happy trading.
Ya soy trader pero me gustaria una estrategia mas en mi arsenal