
Video Transcript
How to tell if a support or resistance level is likely to hold? The key is to watch what buyers and sellers are doing when price reaches that level. And for that, we use Order Flow. Let’s go straight to a real example. Don’t worry if you don’t understand everything yet. I’ll explain each signal in detail, and by the end, you’ll know exactly what to look for and how to use it in real trading situations. So, let’s get to it.
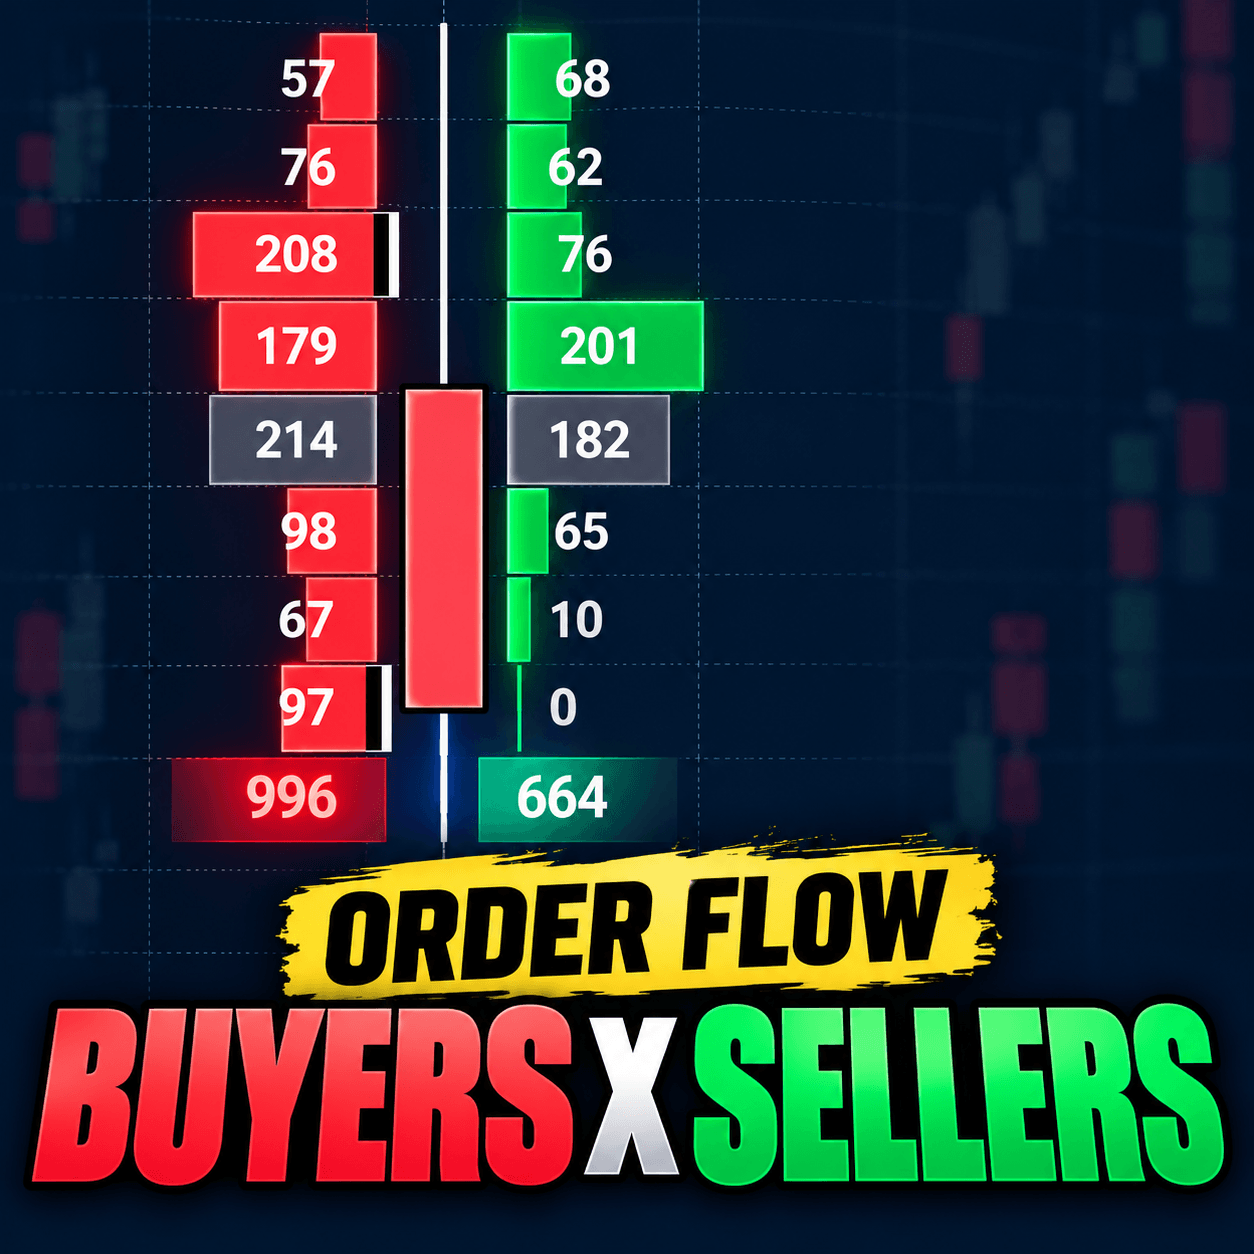
What you see here, this is a footprint from the TradingView platform. Their default footprint looks a bit different, but this one is a little bit customized. If you want to have footprints that look like my footprint, just click the link below this video. There’s a guide on how to set it up, so it looks exactly like this.
So, what you see here, this is a five-minute chart of the Euro-Futures (6E). And you see how the price is rising towards a resistance. This resistance could be a resistance based, for example, on volumes, price action, smart money, FIBO, or VWAP, whatever you guys like, whatever works for you. For me, it’s mainly Volume Profile. But in this video, we’ll be focusing on the Order Flow and on the confirmations, not on how to find that support or resistance. Okay?
So anyways, what you see here is the price made it to a resistance, and now we want to see some kind of confirmation that the sellers are jumping in and that the price is likely to reverse. Now, at this moment, when the price actually hit that resistance, I actually don’t really see any confirmation that would tell me to enter a short. At this point, it actually looks like the price is likely to continue to move upwards. The reason is that we see a lot of buyers here on the ask side of the footprint. It looks like aggressive buyers are just pushing the price upwards and that the resistance is going to get ignored. But let’s see what the next five-minute footprint will bring.
Now the situation changed dramatically because now we can see sellers jumping in, and we see a couple of the confirmation signals that I’m going to teach you later in this video. So, the first thing that I would like to point out here is a change in delta. When the price was rising, the delta was positive. Everything as it should be because when the price is rising, the buyers are in control and the delta should be positive because delta is essentially the difference between aggressive buyers and aggressive sellers. If delta is positive, then the price is usually rising.
But when the price reached that resistance and this footprint formed, delta turned negative. That means sellers started to jump in, and in this footprint, sellers are in control. So, that’s the first confirmation: change in delta. Let me tick this in this little confirmation checklist.
And let me now talk about the second thing that I see here that confirms that the price is likely to turn. The second thing is trapped traders. Notice those heavy volumes here at the top of this candle. When we saw the previous footprint, I said that this is looking like the price is likely going to continue to move upwards because at the top of this candle, we see heavy volumes of buyers. But what happened instead is that the price reversed. Now we have a bearish candle here. And that means that those buyers here at the top of this candle, they got trapped there, and they are likely to quit their positions because they weren’t able to push the price upwards.
So, they are going to quit their trades. And since they were long, they’ll need to quit their trades. That means that they’ll need to go short. That means this will fuel the sell-off, right? Because they’ll be quitting their positions with market sell orders. So, that’s another confirmation: confirmation by trapped traders.
Again, don’t worry if you don’t understand a thing. We’ll look into all those setups separately in detail, and I’ll explain everything. Okay? Now, I’m just showing you what will be the bigger part of this video and what I’ll teach you today.
So, we have changing delta, we have trapped traders, and one more thing that I can spot here in this newly formed footprint is aggressive traders jumping in. I can see those aggressive traders here. Those heavy volumes at the bid are telling me that aggressive sellers are jumping in. Usually, this is like when the price hits a resistance, then some kind of reaction starts to happen, and then sellers notice this and start to jump in, and they want to enter the trade and participate in the sell-off, and those are those sellers, aggressive sellers, jumping in. Another reason for you to jump in as well because this is another confirmation.
Right on this example, I don’t really see confirmation by big limit order nor by absorption. But that’s completely fine. We don’t need to have all those checked in order to enter a trade. Usually, a couple of them is enough for me to jump in a trade. If it’s a good level and I get a good confirmation, good and clear confirmation, then one confirmation is enough for me. Obviously, the more, the better. In this case, we got three. And let me now show you how the trade played out.
All right. So, this is what I’m going to focus on in today’s video. But first, I need to focus on those setups, and then we go back to the real examples where I’ll show you how everything clicks together and how you can use it together.
Okay. So, we’ll be looking for those five different confirmations. It’s absorption, big limit orders, trapped traders, aggressive traders, and change in delta. Now, I’ll cover them one by one just briefly. If you guys want to learn more about those individual setups in more detail, then what I recommend is checking out my Order Flow book.
This is how the book looks like. If you guys want, I’ll send it over. If you are from the US, I’ll send it over for free. I’ll even cover the shipping. I’ll drop a link below this video, and just click the link, fill in your address, no strings attached. Just order the book. I’ll send it over for free, and you can learn more about the setups there.
I’ll also add a link below this video that will point you to our Order Flow webinar that explains those setups a little bit more in detail.
Okay. Anyways, let’s now go briefly through the setups and then into the real examples.
So, the first setup is absorption. I would say this is my most favorite setup. And what the absorption setup means is that unusually heavy volumes appear at the same time at bid and ask at the same price level. If you take a look at this picture here, then you can see that we have unusually heavy volumes at the bid as well as ask at the same price level, right? That’s important. And that’s the absorption.
On this picture, you can see that the price was dropping, and those volumes at bid are showing sellers pushing the price downwards, aggressively selling. At the same time, if you see heavy volumes at ask, that means buyers buying everything that the sellers are selling. That’s why the price stops, and that’s why there’s likely to be a reaction afterwards.
Okay? So, unusually heavy volumes at bid and at ask at the same price level. Now, don’t look for this setup just anywhere on the chart. You want to see this only around strong support or resistance zones. That’s very, very important. As I was saying, that support or resistance zone could be anything you guys like to trade with: Volume Profile zone, VWAP zone, smart money concepts, anything that works for you, but it shouldn’t appear just anywhere on the chart, only around your support or resistance zone.
If you see that, that’s a confirmation to jump in your trade. Okay, so that’s the first confirmation, confirmation by absorption.
Now, the second confirmation is confirmation by big limit order. So, what you look for is, for a long trade scenario, you look for unusually heavy volume at bid, and for a short trade confirmation, you look for unusually heavy volume at ask.
Let’s check out this example. This is a short trade example because here we have a resistance. Let’s say that the resistance is somewhere in here. Okay. The price rose towards that resistance, and here this appeared: 193 contracts at ask.
Now I know what you think. You think that heavy volume at ask. That means strong buyers, right? Well, that’s not true. It’s strong buyers only if they entered with a market order. But since the price just hit a resistance, it’s very, very likely that this is not an aggressive buyer with a market order. It’s more likely that this is a big seller with a limit order.
And the thing with limit orders is that if you have a limit sell, then it shows up at ask. If you have a limit buy, then it will show a bid. This is how it goes. Not many people actually know this. Not many people actually teach this, but you’ll have to trust me. It’s like this.
If you want to learn why it’s like this and if you want to dig deeper into this topic, then I’ll drop a link below this video, and it’s about bid and ask and what it actually shows and how you can use it. But if you don’t watch the video, just trust me on this.
If you see heavy volumes here in a resistance, it’s very likely a big seller entering with a limit sell order. So, for short trade confirmation like here, you need to see unusually heavy volumes at ask, and this is it. When you see this, that’s your confirmation and you go short.
Okay. The long trade scenario would be the same, only reversed. You would be looking for unusually heavy volume at bid, and you would be looking for this around strong support. Okay, so this is the big limit confirmation.
The next one, the next confirmation, is trapped traders. What it means is that breakout traders get caught on the wrong side and their exits help fuel the reversal. Let me show you on this example here.
You can see that the price is rising, and then you can see all those heavy volumes here at the top of this candle. Normally, that would mean that this is a signal that the market is going to continue up. But what if it doesn’t? If it doesn’t and the next candle or footprint looks like this, it’s bearish. It goes the opposite way.
That means that those guys got trapped because they were not able to push through, and the other side of the market is stronger. Those guys got trapped, and they will need to quit their trades eventually. So, since those were buyers and they were in a long position, they’ll need to quit their trade. That means that they’ll quit their trades with market sells. Okay, that means that will help fuel the sell-off. That’s the trapped traders in this case.
This is a short trade scenario because it’s confirming a short trade. And again, as with all the setups that I’m talking about in today’s video, you only look for this around support and resistance zones. So, this needs to happen in a resistance zone in order to be interesting and in order to be confirmation to actually enter that short trade. Right? If this happens anywhere else on the chart, it doesn’t really mean a thing.
One more thing that you should watch for is imbalances because trapped trader concept or setup works best if you see imbalances. TradingView prints the imbalances like this, those black bars, and imbalance means that one side of the market is way more aggressive than the other one. You compare diagonally like this.
So, the Order Flow compares those two sides, and if one of them is way more aggressive, volumes are way heavier than on the other side, then it marks it as an imbalance. Usually, this would tell you that the market will continue moving up, right, because buyers are dominating here. There are buying imbalances. There are heavy volumes that are most likely volumes of strong buyers. So, this screams at you that the market should go up, right? If it doesn’t, then those guys got trapped, and you’re looking at trapped traders, and the market will go the opposite way.
Now the next one, aggressive traders. Aggressive traders is when strong market orders step in and actively push price away from your trading level. So, imagine that we have a strong resistance somewhere in here. The price reaches that level, and then when the price hits that resistance, you see heavy volumes at bid. Heavy volumes at bid usually mean aggressive sellers. And that’s exactly the confirmation that you want to see when price reaches a strong resistance.
You want to see sellers jumping in. Aggressive sellers. This is exactly it. This is the confirmation to jump in short because price hit a resistance and sellers started to jump in. You should join them too, and the market should react like this.
Okay, this is aggressive sellers. An important thing is that you only look for this when this occurs around a strong support or resistance zone, not just anywhere on the chart. If it does appear anywhere on the chart, it’s just noise. Don’t pay too much attention to it. Just focus on it only if it’s near a support or resistance zone. That’s when it matters.
Okay. The last one, change in delta. What you look for is when delta shifts near the level and shows traders trading in our direction. This is rather simple since most of the Order Flow software prints delta below each footprint or in the footprint summary below each footprint.
And what the delta shows is essentially the difference between buyers and sellers. Here in this footprint, delta is positive. That means buyers were in control in this footprint. In the next footprint, though, delta turned negative. That means sellers are in control in this footprint.
If a price reaches a resistance, let’s say that we have a resistance somewhere in here, and you see a shift in delta from positive delta to negative, that means sellers started to jump in, and in this footprint, they’re dominating. If this happens around your resistance, that means that you should go short as the price is likely to drop.
Okay, this is reaction to your level. That means sellers are jumping in and pushing the price downwards, and they are dominating. This is the change in delta. This is a short trade scenario. Long trade scenario would be the same, only reversed. That means that in a dropping market, you would be looking for positive delta. That means buyers jumping in, and price is likely to go up.
Important thing, you only look for this around strong support or resistance zones, not just anywhere on the chart, right? That would be just random noise. You want to see this around strong support and resistance zones.
So, that’s the five setups that I like to use for trade entry confirmation. Let me just do a quick summary before we go into the real trades.
Okay. So, the absorption setup is when you see unusually heavy volumes both at bid and ask. That’s the confirmation for you to jump in a trade. Big limit order is unusually heavy volume at top or bottom of a candle, depending if you are looking for short or long.
For example, like here in a short trade scenario like here, if that order appears on ask, then it’s likely to be a short limit order and the market is likely to drop. Next one, trapped traders. That means that if, in a short trade scenario, price is rising and then it looks like the price is going to continue to move up, but it doesn’t. It moves the opposite way. Then those guys got trapped, and they are trapped traders, and the price is likely to drop.
Next one is aggressive traders. That means that when the price hits a level, aggressive traders start to appear. In this case, this is a short trade scenario. So, we are looking for aggressive sellers, and those aggressive sellers jump in, and that’s why the price starts to drop.
The last one is change in delta. Delta is below the footprint, and you want to see a change in delta around your support or resistance zone.
Okay, so those are the five confirmations, and now we’ll take a look at a couple of real trade examples. I have here the confirmation checklist where I’ll be taking the setups that we see, and this will help us to see who is more aggressive around the support level and if we should enter the trade or not.
Okay. So, let’s take a look at this example. This is an example of the ES. You’re looking at the five-minute chart, and here I want to take a look and tell me if you see some of those setups around that support level. I’ll give you a couple of seconds to think about this, and then I’ll help you out a bit.
So, what I think is going on here is when price dropped towards that support, I think that the selling pressure is being absorbed here because we have heavy volumes both at bid and ask. The volumes, by the way, don’t need to be exactly the same. It just needs to be unusually heavy volume. Note here, okay? In this case, it is both at bid and at ask as well. So, I would count this as an absorption setup.
The other confirmation is the delta. And quite a funny thing is that even though the price is dropping, you can see that deltas are actually positive. See, all the deltas are positive. That means that even though the price is dropping, buyers are dominating and the price is likely to move up. But where? Quite possibly around our support level, right? So, we have another confirmation, this time by the delta.
Now let’s see if the next footprint will bring any new information to this. By the way, in this case, I will just enter the trade right now at the close of this candle because two confirmations, that’s good enough for me. But let’s say that we want to play this safe, okay, and we want to see what the next footprint will bring before we jump in that trade.
So, this is how the next footprint looks. Good thing is that the delta is still positive. And one more thing that could confirm our trade entry here is aggressive traders. We can see aggressive buyers jumping in right here. Those 123 contracts. That’s quite a heavy volume, and it appeared in our support zone. So, we have aggressive buyers jumping in, and that’s the third confirmation to enter that trade.
I can’t really see confirmation by trapped traders nor confirmation by big limit, but you will rarely see all those five. So, if you see three of them, it’s more than enough to jump in a long trade. Usually, at the close of the candle that the confirmation occurred, right? So, let’s see how this played out. Nice reaction. See? So, this is how you can use the confirmations.
Right. Now let’s check out another real trade example. And again, try to spot the confirmation here. I’ll give you a couple of seconds, and then I’ll help you out a bit.
So, looking at this, so far I can only spot one confirmation, and it’s confirmation by absorption because I can see that there are heavy volumes both at bid and ask here in our resistance zone, and usually this would be quite okay for me to just pull the trigger and go short. I admit I’m a bit more aggressive with my trade entries.
But if you guys are more conservative and if you want more confirmations, then I recommend waiting a bit for the next five-minute footprint to show, to see if there’s something else confirming that you should push the sell button.
So, what I can see here is change in delta. Here the delta finally turned negative. That’s important. If you want to go short, the delta should be negative. So, we have another confirmation, and that’s change in delta.
Anything else you can spot here? Well, another thing that I see here is aggressive traders. I see aggressive sellers jumping in here. See those heavy volumes and those red cells here? That means aggressive sellers are jumping in.
What quite possibly happened here is that the price hit that resistance. There was that absorption. The sellers noticed, and they started to jump in aggressively, right? With sell market orders. That’s the trigger. That’s another thing that’s telling you to join them and go short as well.
So, we have aggressive traders as well. Now one more thing we can consider is the trapped traders because we see imbalances in here, imbalances in here, quite heavy volumes here, and those guys are looking to be going long, right? But what the price did instead is that the footprint is negative. The price went down instead of going up.
So, those guys are probably trapped here, and they’ll fuel the move down because they’ll need to quit their long positions by selling. That’s your trapped traders confirmation right here. I can’t really spot the big limit confirmation, but that doesn’t matter too much. We have four confirmations already, so that’s good enough to go short and have the chances in your favor.
Okay, so let me show you how this played out.
Okay, here is the next one. Again, take a look at it. I’ll give you a couple of seconds and try to tell me what kind of confirmation do you see, if any, on that resistance zone.
We are looking at a five-minute chart of the ES, and the price just hit a resistance, went up slowly, but it hit the resistance right here. The first thing that I noticed is this heavy volume at the top of this candle, quite possibly a limit order, a big limit order. Let me take this as the first confirmation.
For some of the more aggressive traders, this could be enough to jump in. In this case, I would probably wait a bit to see what happens next. So, let me show you the next footprint.
Okay. So, what can you see here? Take a look at the next footprint and tell me if you see some more confirmation to go short or not.
What I see here at first glance is change in delta. This is easy to spot. Delta finally changed to negative. That means in this footprint sellers are in control. This is telling me to go short, and it’s another confirmation.
Another thing that I can spot here is aggressive traders, especially this high-volume node where we have 175 contracts on the bid. Those are very likely aggressive sellers with market sell orders pushing the price down. So, that’s our aggressive traders.
Now let’s go back to this sell. We chose 193 contracts here. Now it might be two things, actually. It could be a big sell limit order, or it can be somebody who went long and is now trapped. So, it could be either big limit order or trapped traders, right? One of them.
We can’t really be sure which one of them, but for sure it’s one of those. So, either big limit or trapped traders who got trapped here. The market moved down, and now those guys need to sell to get rid of their positions. So, it’s one of those. Hard to tell which one. In either case, it’s a confirmation.
Now, in this scenario, I can’t really spot a solid absorption setup. So, let me just cross this since it’s clearly not there.
Okay, so we have three confirmations. One, two, and one of those, which should be more than good enough for you to decide to enter a trade at the close of this footprint. That means short from here. Let me show you how it played out like this.
Right. So, let’s now check out the next one. Trade number four. This one is on the Euro futures. Again, we are looking at the five-minute chart. I’ll give you a second to check the chart and decide if you can spot any confirmation here.
So, what I can spot here at the first glance is that when the price hit that support which we have here, I can see that we have unusually heavy volumes both at bid and ask. They are in gray because it shows where the heaviest volumes in that specific footprint got formed, right? It’s in here at this price level.
And I think that in this case it’s absorption. I think that those 109 contracts are sellers trying to push the price down. And on the other side of the footprint is 105 contracts of buyers buying everything the sellers are selling and going long from there.
So, this is the absorption setup, and I’ll just take it in here in the checklist, and let me show you what the next footprint will bring.
So, check it out, and again I’ll give you a second to take a look at it and tell me if you see some other confirmation there.
Now the easiest thing to spot, I would say, is always the delta because it’s written below each footprint. We had a negative delta here, and in the next footprint it changed and it turned positive. That means that in this footprint buyers are dominating. So, we have a confirmation by delta.
And can you spot anything else? I would say that there’s also confirmation by aggressive traders. 141 contracts here on the ask side and 173 here as well. Those are likely buyers who are jumping in to join the party, and they are going to help to push the price upwards.
So, aggressive traders, another confirmation, right? Anything else? There’s one more thing. There’s also trapped traders. See those imbalances here. Those sellers were trying to push the price downwards, but they failed because the next footprint looks like this. It’s a bullish footprint. And those guys got trapped. So, they were short, and now they’ll need to quit their trades. That means that they’ll need to go long, helping price to move up.
So, we’ve got trapped traders. I can’t really spot a big limit order anywhere. So, I’ll just cross this. And looking at the confirmation checklist, we have four setups present. It’s beautiful. And what the price should do is it should move up. Let me show you how it played out.
Okay. Again, I would probably, because I’m a bit more aggressive with this, enter after the absorption. So, I probably enter the long from here. If you are more conservative, then enter after you have more confirmations. So, that’s after this footprint closed. Okay. From here.
Now, let’s take a look at the next one. Trade number five. This is a chart of the ES again. Five-minute footprint chart, and I’ll give you a second to take a look at it and tell me what you think is going on here around this resistance.
So, at this moment it looks like the price hit the resistance and somebody big just entered with a short limit order because short limit order shows at ask right here. So, I would say that we are looking at our first confirmation by big limit.
But now that’s more or less it. So, let’s see what else do we have here in the next footprint. Again, I’ll give you a second to take a look at it, and then I’ll help you a bit.
So, what I can see here is heavy volumes both at bid and at ask close to our level. That’s absorption, right? Absorption setup confirming that the buying pressure is being absorbed and sellers are jumping in, trying to push the price downwards.
Let me show you one more footprint here, and maybe it will give us some more information about what’s going on here. Because what’s kind of weird was those 231 contracts with imbalance at the top of this candle. That’s kind of weird, right?
But since the next footprint is a bearish footprint like this, we can tell that those guys are trapped traders. They got trapped. They tried to push the price up, but they failed, and they are trapped traders most likely. It could be somebody with a limit order as well. You can’t really tell for sure, but I think that those guys are trapped traders. And we can check another setup from our checklist.
Now the next thing that I can spot here is that aggressive traders started to jump in. You see those heavy volumes here. Those heavy volumes at bid mean that those guys are very likely aggressive sellers entering with market sell orders.
They saw that there was that resistance. They saw that there was absorption. They saw the limit order, quite possibly the trapped traders, and they decided they want to join the party. So, they started to enter the trades with sell market orders, and that gives us another check on our checklist.
Now the last thing is change in delta. Finally, with the latest footprint, the delta turned negative. That means finally sellers are in control. At this point, it’s quite clear that the resistance is going to work and that from this point, it’s quite safe. Well, I shouldn’t really say quite safe because in trading, nothing’s really safe, but chances are that the price will drop.
Okay, let me show you how it played out.
So, yeah, in this case, we had all five setups confirming our trade entry. I would say that this is the best you can hope for. So yeah, this is how this one played out. And let’s check out another one, shall we?
This one is on the Euro futures. Again, you’re looking at the five-minute chart. What the price does is it moves up towards a resistance. By now, you’ve probably noticed that there is this heavy volume sitting at ask. That means that this is likely to be a limit order placed by a seller. So, sell limit order.
Now, another thing to notice here is the change in delta. When the price was rising, the deltas were positive, but now the price hit the resistance and delta turned negative. So, we have another confirmation here: change in delta.
Anything else you can see here? I can’t. So, let’s see what the next footprint will bring.
What’s great is that in the next footprint, the delta is still negative. That means sellers are still in control. We can also see some aggressive sellers jumping in, those guys. So, let me just check this.
And also, maybe those guys that we thought were a limit order, maybe they are trapped traders because we had heavy volumes here at the top of this candle, and then what followed was a bearish candle. So, actually, this could be either big limit or trapped traders, one of those. We can’t really tell which one, but either way, it’s a confirmation, either by big limit or trapped traders.
I can’t really spot absorption here, so I’m going to cross it.
Okay, so we’ve got a couple of confirmations here. So again, I would say that this would be a resistance worth trading, either from this place, from the close of the first footprint, short from there. If you want to be safer, then at the close of this footprint, short from there. Okay, let me show you how it played out in the end.
Like this.
Now, I hope you don’t mind that I’m not talking about stop-loss placement, take-profit placement, position management, or how to find the resistance or support zones. The video would simply be, you know, too long. Even like this, it’s, I would say, packed with information, for some people hard to digest.
So, if you want to learn everything about how I trade with Order Flow, then you’ll find it in this book. Don’t forget to get it from the link below. If you are from the US, then I’ll send over the book for free, even cover the shipping. If you are not from the US, there will also be a link for ebook download, so you can get the book at least as an ebook.
Let’s go to the last example, and it’s on the Euro futures. Again, it’s a five-minute chart. And I’ll give you a second to take a look at this picture and tell me if you can spot any kind of confirmation to jump into a long trade from this support zone. Okay? So, check it out.
So, usually what I notice first is the absorption. If there’s absorption, then you know that’s the thing to notice at first. At least I notice it at first. And in here, the absorption is in here, right in that support. So, beautiful absorption. I’m going to check this one here.
And now let’s think about this, and you guys tell me whether we would enter the trade here or if you would wait, because, you know, I can’t really see any other confirmation here. So, it’s kind of a tricky thing, especially because the price is dropping quite aggressively downwards.
So, this is a tricky, tricky trade. As I was saying a couple of times already, I’m a bit more on the aggressive side of trading. So, I would probably just enter the trade right here. But I imagine that a lot of you guys would be more conservative, and that means waiting for the next footprint to form.
So, let me show you how it looked. There’s good news and there is bad news. The good news is that the new footprint gives us a couple of new pieces of information to work with. The bad news is that at this point it’s a bit too late to enter the trade because there’s already been a rather significant move, a rather significant reaction to the support.
So, at this point I wouldn’t be chasing the market. The level is spent. I trade only the first touch. So, either you entered at that absorption here, or you would need to skip the trade because at this point it would be just too late.
Just for the sake of learning about the setups, let me point out the confirmations in this new footprint. Okay. So, we have change in delta. Then we also have trapped traders because check out all those imbalances, all those volumes here screaming at you that the price should go down, but it doesn’t. It goes up. So, those guys got trapped, right?
So, we’ve got trapped traders, and that’s more or less it, I would say, because I can’t spot any significant big limit order nor aggressive traders. So yeah, those would be the confirmations, but the only one that actually came in time was the absorption.
And the question is, is that enough to enter the trade or no? So yeah, it’s not a shame to miss a trade if you are not sure or if the market simply reacts too soon, too quickly, and you’re just not able to take it. No shame in that. Better to miss a trade you’re not sure of than be caught in a bad trade.
So, I hope you guys like this. If you want to learn exactly how I trade with Order Flow from A to Z, exactly my strategy, and if you also want to get your hands on my custom-made Order Flow indicators and join our trading community and be part of the Trader Dale team, I recommend visiting our website, which is at trader-dale.com
If you click this button, Trading Course and Tools, then it will bring you to a page where you can browse my trading education and custom-made indicators.
Yeah, currently we are running a special Halloween sale. That means that you can get those packs for a discounted price. If you guys are interested in Order Flow trading, I recommend getting the Order Flow pack, which includes everything you need to know about Order Flow trading and also my custom-made Order Flow indicators.
You can get the pack in here. Or if you are interested in all four packs, there’s actually a special deal. You can get this at the bottom of the page. You can get all four packs all together, lifetime access, all indicators, all education, everything for $697 until the end of the month. That’s our special Halloween sale. This is the lowest price we’ve ever been selling this for.
So, check it out. If you have any questions, shoot me an email, let me know.
All right, so thanks for watching. Have a great day, and I’ll see you next time. Until then, happy trading.
