
*Disclaimer: Presented opinions, trades and trading ideas on the markets and charts is not advice nor a trading recommendation. It is general information and it is for educational purposes only.
**You can learn more about my trading setups in my Volume Profile Webinar
SWING TRADES
All presented swing trade charts are Daily charts (Daily candles).
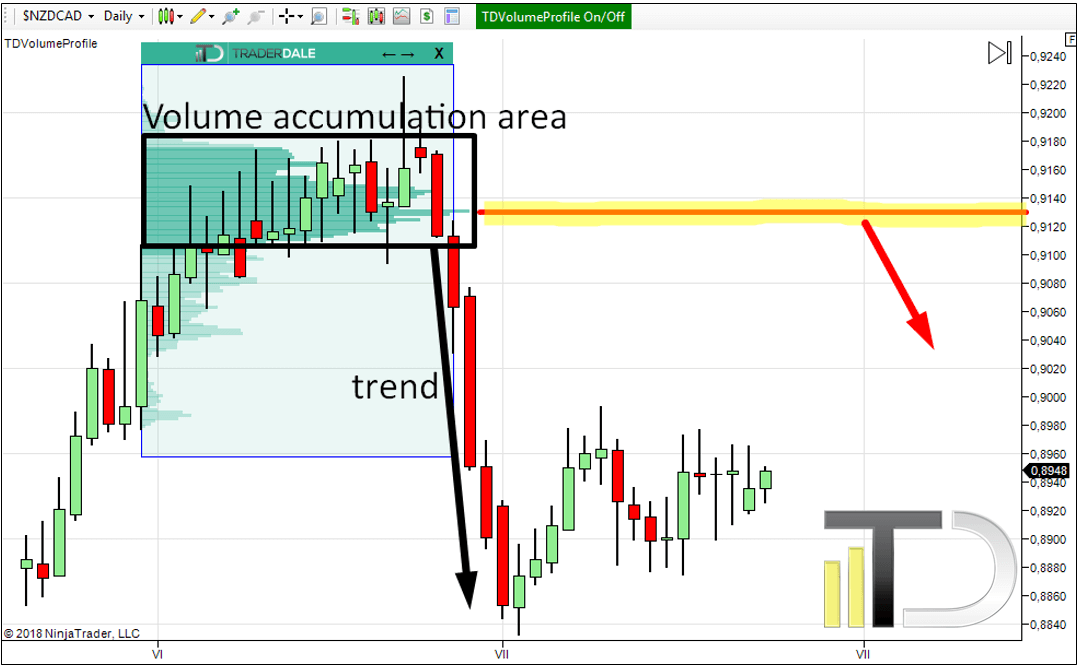
NZD/CAD short from 0.9120 – 0.9140 area
There was a pretty long rotation which was followed by a strong sell-off. Probably a lot of selling volumes were accumulated in the rotation area. The heaviest volumes were accumulated at 0.9130. After the sellers accumulated their selling positions, they started an aggressive selling activity.
I think that the sellers will initiate another sell-off when the price returns back to the 0.9120 – 0.9140 area. They will do it in order to defend their selling positions.
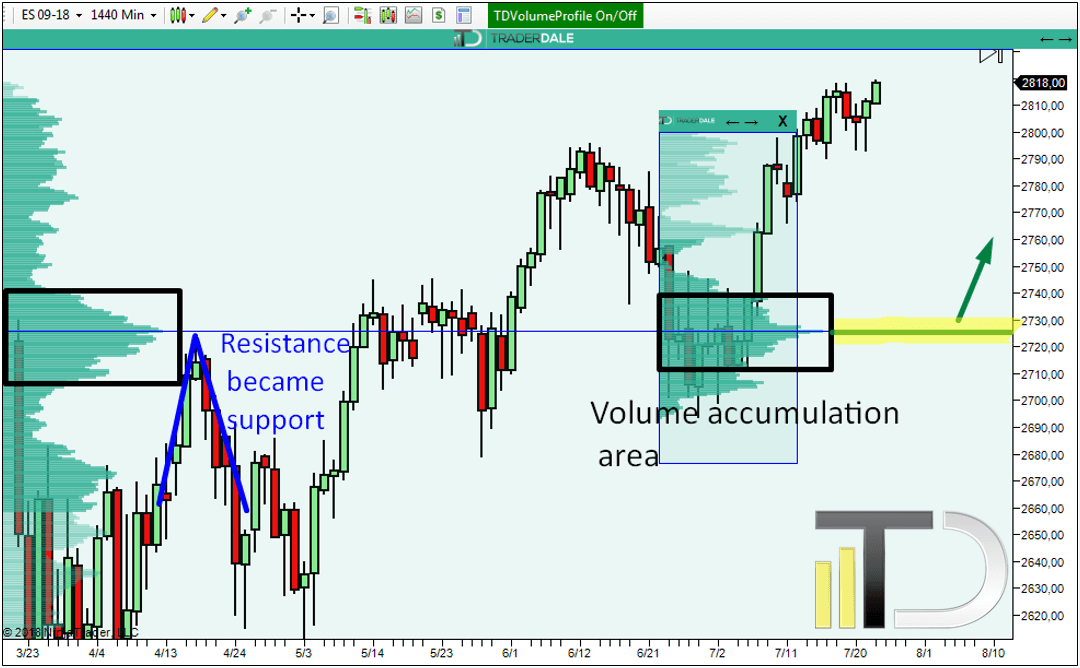
S&P 500 (ES) long from 2720.0 – 2730.0 area
There was a volume accumulation area right before a strong buying activity on the ES (futures for S&P 500). I think that a lot of buying positions were accumulated there because of the bullish activity that came after the accumulation.
The level is also significant from the longer point of view. If you look at the cumulative profile that shows the whole area, you will see that the heaviest volumes were accumulated also at this price level.
Additionally the level worked as a strong resistance in the past. When the price went past it, the resistance became a support which should hold the price again.
I think this is a pretty solid level to go long from because of all the reasons mentioned above.
INTRADAY TRADES
All presented intraday charts use 30-minute timeframe (30-minute candles).
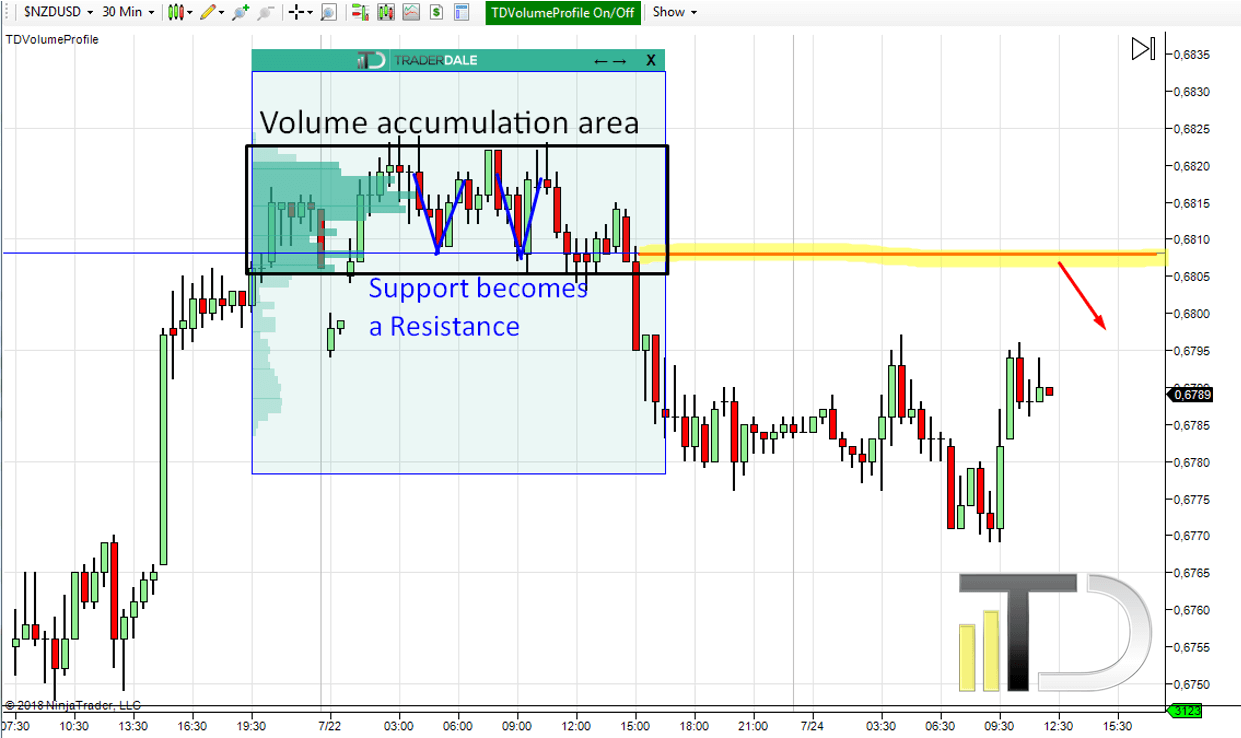
NZD/USD short from 0.6805 – 0.6810 area
I think this is a good short level for two reasons.
The first reason is volume accumulation that took place in a sideways price channel. When the channel broke, the price went downwards. This indicates that the volumes accumulated in the rotation were volumes of strong sellers.
The second reason is that the level worked as a strong support. The price reacted to it strongly twice in the past. After the price went finally through the support it became a resistance.
When the price makes it back to this level I think that strong sellers will initiate a new selling activity in order to defend their selling positions. This will cause the price to go down again.
USD/CHF short from 0.9980 – 0.9990 area
There is a very nice case of the Volume accumulation setup on the USD/CHF.
The downtrend tells us that the volumes accumulated in the rotation were most likely volumes of strong sellers. When the price makes it back to this level, those sellers will try and defend their selling positions by aggressive selling activity. This should push the price lower again.
*You can also notice how nicely the price reacted on the volume cluster created within the trend (Trend setup).

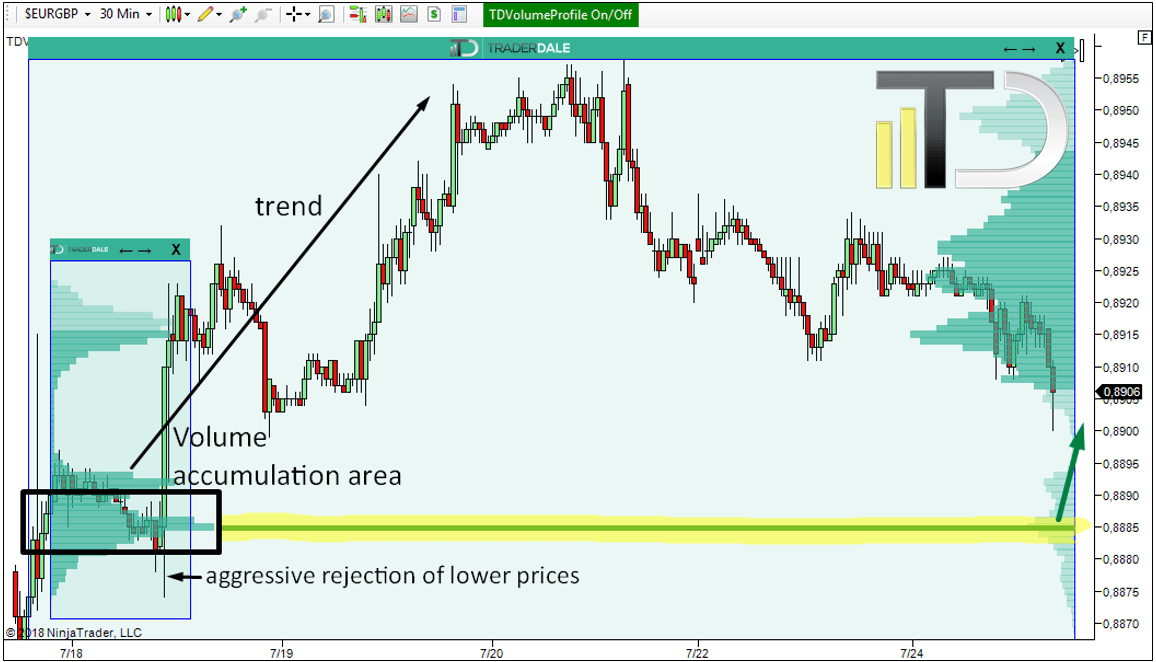
EUR/GBP long from 0.8885
Another very nice volume accumulation setup is currently on the EUR/GBP. What I like about this long level is the aggressive rejection of lower prices which occurred right before the start of the trend. This shows the strength of buyers who rejected lower prices and pushed the price upwards. Those buyers were accumulating their positions in the rotation area before the start of the trend.
When the price makes it back to this level, those buyers will most likely defend their positions and they will push the price higher again.
Want my intraday trading analysis every day as well as swing trade analysis for 15 forex pairs every month? Then check out my Advanced Volume Profile Training Course and Members Forum for more information – Click Here to Start Learning Now
Your N/U level would of been fantastic if you took the normal level at where the most volumes were accumulated 6815. High on my chart was 6818 before a nice reaction lower. I’m curious why you chose to use the support level as the entry instead of the normal level of where most volumes were accumulated at least that’s what i have understood so far.
Hi Brian,
I took the lower level because it was Support which became a resistance. And there was still some room even if the market reacted to the higher (volume-based) level.
Hi Dale, it looks like you’ve expanded your intraday (M30) pairs from just four to all the majors. Is this a permanent change? And if so, what prompted the change?
I just saw nice opportunities there so I wrote about them. I think I will write more about other pairs more often.
That would be great so people can observe for a while to decide to join or not
I know most of your analysis are on Forex, it would be nice to have your comments on /ES /NQ/ YM, Gold and crude on a regular basis.
I can’t really promise you that because there needs to be some nice trading opportunity worth mentioning – which is not always. However, I will do an analysis of those instruments from time to time.