Do you want ME to help YOU with your trading?
Video Transcript:
Hello everyone, it’s Dale here. In
this video, I’ll show you how to use Volume Profile, which is a powerful tool
that reveals where the big players are trading. More importantly, we’ll focus
on the most critical level on the chart: the Point of Control. Here’s what
you’ll learn. You’ll learn what Volume Profile actually shows and how to read
it. You’ll learn why the Point of Control is the most powerful support and
resistance level on your chart. You’ll also learn how to trade the Point of
Control—both the basic and more advanced ways—and, just as important, when not
to trade the Point of Control. I’ll walk you through real trades from my own
account, show you my exact strategy, and also what to do when the Point of
Control fails—because, let’s be honest, it doesn’t work every time. And before
we wrap up, I’ve got a small gift for you, but you need to stay until the
end—and don’t skip. So, let’s get to it. Let’s start with a little quiz so you
guys know where you’re at.
Take a look at this picture right
here on your screen and tell me: where is the price going? Is it going to go
up, or is it going to continue falling? It’s pretty hard, isn’t it, when you
look at just this chart? Pretty hard to tell. Okay, let me help you a bit. This
is the same chart, only now I’ve added daily Volume Profiles. Now the same
question: will the price go up or down?
If you look at the Volume
Profile—this one—then right here, this is the Point of Control. The price hit
that Point of Control and made a reaction to it. As you can see, with just a
plain price action chart, it was rather hard to guess where the price would go.
But with the Volume Profile, it’s actually a very easy level to spot, right?
Because this is the Point of Control. And if you don’t yet understand what I’m
showing you, don’t worry—we’ll get to it. This is just a little quiz to get us
started and to see where you’re at.
Okay, second question—and it’s the
same one as before: where is the price going to go? Up or down? Again, if we
don’t have the Volume Profile, it’s quite hard to tell, right? Just by looking
at the price. But if we add the Volume Profile here, you can see that the price
just hit the Point of Control, which is right here. So, up we go, right? This
is a reaction to the Point of Control.
Now let’s rewind a bit and let me
start from the beginning. Let me do a little introduction to what the Volume
Profile is, and then we’ll continue to the setups that I use to trade the Point
of Control. Volume Profile is basically a histogram that shows volume at price.
If you look at the Volume Profile, this is it. The wider the profile, the
heavier the volumes that were traded at that price level. This is called the
Point of Control—the level where the heaviest volumes were traded. Essentially,
the profile shows how volumes were distributed throughout the day. So, the
heaviest volumes were in here. Then there are areas with low volumes—at these
price levels, there wasn’t much trading activity. But this area, where the most
people were interested in trading, is the most important.
Volume Profile shows how volumes are
distributed throughout the day (if it’s a daily profile), throughout the week
(if it’s a weekly profile), or throughout the month (if it’s a monthly
profile). As I was saying, the Point of Control is the place where the heaviest
volumes were traded. Today, we’re going to talk about that. The Volume Profile
can take many shapes—these are the four most basic ones—but always, the most
important place in each shape is the Point of Control.
This is something called a D-shaped
profile because it has the shape of the letter D, and the Point of Control is
right here. In a B-shaped profile, the Point of Control is somewhere here. In a
P-shaped profile, the heaviest volumes were traded in here, so the Point of
Control is here. With a thin profile, it can be harder to tell, especially if
there are a couple of volume clusters. But looking at this one, it seems the
heaviest volumes were traded here, so this is the Point of Control. Every
Volume Profile has a Point of Control, no matter its shape or how volumes are
distributed.
As I was saying, the Point of Control
is the most important place on any chart. Through the Volume Profile, you’re
basically tracking the big trading institutions—the big guys who move and
manipulate the markets. The Point of Control, the place where the heaviest
volumes were traded, is essentially where the institutions were most
active—where they placed the most trades. And as you probably know,
institutions move the markets. If you know where they are positioned, then I
believe you are ahead of 99% of retail traders.
It’s interesting because many
professional traders—probably the majority—use Volume Profile, at least as a
supplement to their strategy. Institutional traders also use it. It’s a
standard tool for professional traders. But not so many retail traders use Volume
Profile. So what I’m trying to say is—even if you just place the Volume Profile
on your chart, use simple daily profiles, and look at where the Point of
Control is—just doing that puts you ahead of most retail traders. You’ll see
things they simply can’t see.
In this video, we’re focusing on the
Point of Control. If you’re an intraday trader, you’ll probably be interested
in the daily Point of Control. If you’re a long-term trader, then you might
look at the yearly or monthly Point of Control. Let me show you. This is an
intraday chart—30-minute time frame. I have daily profiles here—each day one
profile. Here’s the daily Point of Control. Another one here. And another one
here. As a day trader, you’re going to be most interested in the daily Point of
Control—the place where the most volume was traded on a given day.
On the other hand, if you’re a
long-term investor, you’ll use a workspace like this one. This is my swing
trading workspace with daily charts. Here, I have yearly Volume Profiles. So if
I trade the Point of Control, I’m interested in the one for the whole year, or
the current year’s Point of Control. Depending on your time frame, you should
decide which Volume Profile to trade. Most of you are probably intraday
traders, so we’ll mostly focus on the daily Point of Control.
The reason I’m making this video—and
why the Point of Control is so important—is because it acts as strong support
and resistance. Institutions placed the majority of their orders there. So if
the price revisits that level in the future—pulls back to it—then those
institutional traders who created that Point of Control will likely become
active again. They’ll defend the level and likely push the price up from there.
This is a long trade scenario: a pullback to the Point of Control followed by a
bounce upward. The idea is that institutions defend the place where they were
active before.
Let me now show you the long trade
scenario. Look at this Volume Profile. The Point of Control is clearly visible
at this level. The price went up from it, made a pullback, and the buyers who
were active there started buying again—defending their long positions—and the
price went up. Now for the short trade scenario: in this profile, the heaviest
volumes are right here—this is the Point of Control. The price pulled back to
this level, and institutional sellers became active again, resulting in a move
downward.
Now, here’s a guide on how to trade
the Point of Control. Step one: identify the Point of Control. That’s easy—it’s
where the Volume Profile is the widest. Then, wait for the price to move away
from the Point of Control, then pull back. Enter on the first touch. Only trade
the first test—I only trade the first test because, in my experience, it has a
higher probability of success.
The alternative method I prefer is
similar, but you don’t place the trade at the Point of Control—you place it at
the beginning of the heavy volume zone. Because the support or resistance isn’t
just the Point of Control line—it’s the whole heavy volume zone. So I place the
trade at the start of that zone. I started doing this because I was missing
trades—price would often react before hitting the exact Point of Control. This
small tweak has greatly improved my results.
So, that’s the long trade scenario.
The short trade scenario would be the same principle in reverse: if the price
moved down from the Point of Control and then made a pullback, the short entry
would be at the upper boundary of the heavy volume zone, just before the Point
of Control. That’s where you’d go short.
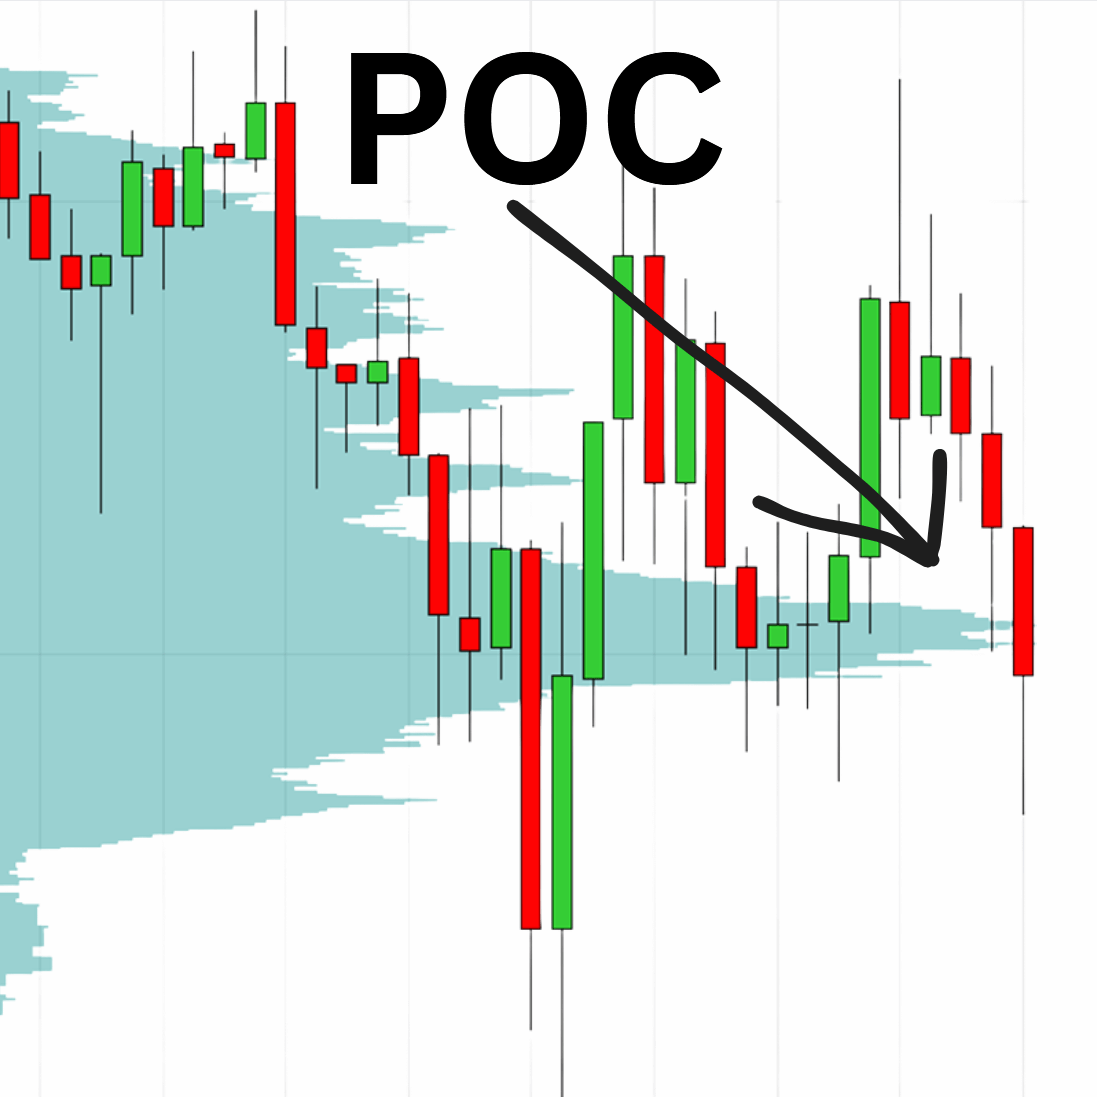
Let’s move on to some examples.
First, take a look at this Volume Profile. It has a Point of Control here, so
I’ll draw a line at that level. The price moves away from the Point of
Control—downwards—which suggests sellers are in control. These sellers accumulated
short positions at the Point of Control, pushed the price down, and now we know
that there are strong sellers at that level. We wait for the pullback, and when
the price hits the Point of Control for the first time, we enter a short trade.
Here’s another example: this profile
has a Point of Control here, price moves away from it, and then makes a
pullback. That’s your entry point for a short. Now a long trade scenario: the
daily Volume Profile shows a Point of Control here. Draw the line, wait for the
price to move away from the Point of Control, then pull back to it. That’s your
long entry.
In this next example, take a look at
the Volume Profile. The Point of Control is here. Now, if you were trading off
the Point of Control directly, you’d look for a pullback and go long from here.
But you can see the price just missed it. That happened to me quite often. So,
instead of entering at the Point of Control, I began placing my trade at the
beginning of the heavy volume zone, which in this case would be a bit
higher—right here. The price hit that level and went up immediately. So, the
beginning of the heavy volume zone worked.
Here’s the same chart, just zoomed
out. Look at this profile—it has a Point of Control here. If I extend the line,
you can see that after the pullback, it just missed the Point of Control again.
That would’ve been a missed opportunity. But with my adjusted strategy—placing
the level at the start of the heavy volume zone—I would enter somewhere here,
and it would be a winning trade. That’s exactly why I made this adjustment.
Now let’s talk about when not
to trade the Point of Control. This is just as important as knowing when to
trade it. No strategy works all the time, so it’s essential to understand the
conditions under which the strategy loses edge. When the market is moving
sideways—in a range or price channel—you don’t want to use the Point of Control
pullback strategy.
Why? Because in a ranging market, the
Point of Control is usually located near the center of the rotation. For
example, this first profile has its Point of Control here, the second one here,
the third here, and the last one here. They’re all near the middle of the
rotation. In a situation like this, you want to trade from the edges of the
range—go long near the bottom, short near the top—and take profit near the
center, which is the Point of Control. In a rotation, the Point of Control acts
like a magnet, not support or resistance.
Speaking of take profits, let’s cover
take-profit and stop-loss placement for the Point of Control strategy. The
rules are simple. Look at this profile. The Point of Control is here. According
to the strategy, you draw a line at this level, wait for a pullback, and go
short. For the stop loss, you want it behind a low-volume area—an area where
little trading occurred. In this case, that would be here. Place your stop-loss
behind this low-volume zone, because it acts as a resistance barrier. If the
price breaks through that zone, you don’t want to be in the trade anymore.
For take-profit, you want to exit before
the price reaches another heavy volume zone—before it hits potential support.
For example, in this profile, this zone could act as support. So, if you’re
short, you want to take profit at the beginning of this support zone to avoid a
bounce.
Again, to summarize: stop-loss goes
behind a heavy volume barrier, and take-profit comes before a heavy volume
barrier.
Let me give you another example. Take
a look at this P-shaped profile. The Point of Control is here. If you use the
alternative strategy, you place your entry a little above the Point of
Control—at the beginning of the heavy volume zone. That’s your long entry. Your
stop-loss goes behind the zone—in the low-volume area. Now, as the price moves
up, you want to find a good place to exit the trade. Look at this D-shaped
profile—it has a heavy volume zone, with the Point of Control here. The
beginning of this zone is right here, and that’s where you want to exit the
trade. Because if the price reacts there, your gains could vanish. In this
case, it didn’t react, but it could have. That’s why we take profit early.
Now let me show you a few real trades
from my own account, which I publish for members of my trading course every
day. These levels are published in advance so everyone can trade them with me.
Here’s a recent trade on the ENQ.
Look at this profile—Point of Control is here. I placed my entry at the
beginning of the heavy volume zone, not the exact Point of Control. The market
opened with a gap, moved up, came back quickly, and bounced. We went long here,
and the price moved up. For the stop-loss, I placed it a little below the low,
to give the trade some breathing room. As for take-profit, I looked at the next
Volume Profile—this was the Point of Control, and I exited here to avoid a
possible bounce. The result: a trade with a risk–reward ratio of 1:1, which is
my minimum.
Another example: a trade on USD/JPY,
30-minute chart, daily profiles. The Point of Control stood out clearly. I
entered from the beginning of the heavy volume zone. The price moved away,
pulled back, and I entered short. Stop-loss went into the low-volume area.
Take-profit was placed before the next heavy volume barrier. It was a solid
trade with a positive risk–reward ratio.
One more example: USD/CAD. Look at
this profile—the heaviest volumes and Point of Control were here. I entered
short from the beginning of the heavy volume zone. My stop-loss was placed
behind that barrier. For take-profit, there was no heavy volume zone in the
way, but there was a weekly VWAP—the blue line. I exited there. VWAP is also a
great place for take-profits. The trade turned out well. If I had held longer,
the price would’ve reached an even better target. But I don’t usually have the
patience for that, so I exited at the VWAP.
These are the kinds of levels I
publish daily in the members area. All members know in advance where I plan to
trade. They get the levels hours—or sometimes days—before price hits them.
If you want to join us and get a full
Volume Profile trading education, including my indicators, daily levels, swing
levels, and tech support, just go to TraderDale.com. Click on “Trading
Course & Tools” to get one of the packs. If you’re interested in
Volume Profile, go for the Volume Profile Pack. It includes 15 hours of
training, daily trading signals, and my custom-made indicators for platforms
like NinjaTrader, MetaTrader, and TradingView.
And if you want to trade with me and
other pro traders live every day, click the “FTA” button—Funded Trader Academy.
There you can learn more about the service and book a call with us. We’ll
explain everything, and you can decide if it’s right for you.
But before we wrap up, there’s
something very important I still need to show you—what to do when the Point of
Control fails.
Let’s now talk about what to do when
the Point of Control fails—because so far, I’ve shown you nice clean scenarios
where it works perfectly. But let’s be real: it doesn’t always work like a
charm.
If the Point of Control fails, it
means there’s been a change in sentiment. And what you can do is take a
reversal trade. A reversal trade means you trade the same Point of
Control again, but from the other side.
Let me show you—it’ll be easier with
a little drawing. Look at this profile. It’s a nice D-shaped profile. The price
moves away from the Point of Control (that’s the horizontal line), comes back
to it, and you go short. But in this case, the trade fails. The price shoots
past the level. That’s when you consider a reversal trade. Extend the same line
a bit, wait for a pullback, and enter again—but this time go long from the
other side of the same level. That’s your reversal trade. You’d be surprised
how often this works and how precisely the market reacts—right to the pip—off
that same Point of Control, just from the other side.
So what I always tell my students is
this: the Point of Control, even when it “fails,” still gives us very important
information. It doesn’t mean the level was bad. It simply means buyers (or
sellers) were stronger and sentiment shifted. We adapt.
You wait for the pullback, and very
often, the market gives you a second chance to enter—this time in the opposite
direction. So if you originally went short and took a loss, the reversal would
be to go long from the same level.
Here’s another example. Take a look
at this profile. This is the Point of Control. The price moves away from it,
comes back, you go long—and it fails. The price blasts right through with no
reaction. In that case, you wait for a pullback from the other side. When price
comes back to the level from above, you go short. That’s your reversal trade.
It would’ve worked perfectly.
The ideal scenario for a
reversal trade is when price shoots past the Point of Control quickly, without
any reaction. It could happen during macro news—that’s fine. For instance,
there’s the Point of Control, and price moves up and blows through it in one
strong candle. Perfect. That tells you sentiment has changed aggressively. Then
you wait for the pullback, and enter from the other side.
Now, let’s do a very quick summary of
everything we talked about:
- The
Point of Control is the most important level on your chart. It shows where
institutions are positioned.
- Because
of that, it works as a strong support or resistance level.
- You
trade pullbacks to the Point of Control—go long or short on the first
test.
- Don’t
use this strategy in a ranging market. In that case, the Point of Control
acts more like a magnet—not support or resistance. In a range, you should
trade from the edges toward the center, and use the Point of Control as a
take-profit level, not an entry.
- If
the Point of Control fails, take a reversal trade. Wait for the pullback
and trade from the other side of the same level.
That’s it! And as a thank-you for
staying until the end, I’ve got a little gift for you. This is my bestselling
book: Volume Profile: The Insider’s Guide to Trading. I’m giving away
free physical copies, and I’ll even cover the shipping. It’s a gift from me to
you for sticking around. I’ll keep sending the books until we run out of stock.
If you’re in the US, just click the
link below, fill out the form, and I’ll send it to you. No strings attached.
Just enjoy the book—and let me know what you think.
Thanks again for watching the video.
Thanks for staying until the end. I’ll see you next time.
Until then—happy trading!
15418 Cruiser St
Unit A
CC,TX 78418
Great video! Thank you so so much for sending me your book. Great video!
I didn’t see the link you mentioned in the POC video, to get a free hard copy of the volume profile book.
Can I get a physical copy.
19 Clarion Quay,
North Wall Quay,
Mayor square,
Dublin
Ireland.
Useless in real trading
I want