Hello guys,
This training article is going to break down how I analyze the markets from a long-term point of view. My swing trade levels are always based on the exact analysis we are going to cover here. Let’s have a look at how I set up for a trade, step by step.
Trade Analysis Requirements
For this analysis, you will need cumulative Market Profile (or yearly) that will show you the long-term volume histogram. For that, you can use Market Profile from TradingView (PRO subscription). You will also need to use daily profiles or short-term cumulative profiles (also from TradingView) to place the levels more precisely. As for the timeframe, I use mainly daily candles with the cumulative (yearly) profile and the 30-minute chart for the daily or short-term cumulative profiles.
Note: Daily profiles with 30-minute candles are just for putting my swing levels more precisely. They are not that significant in the bigger picture. What matters most in this kind of analysis is a yearly profile on the Daily chart.
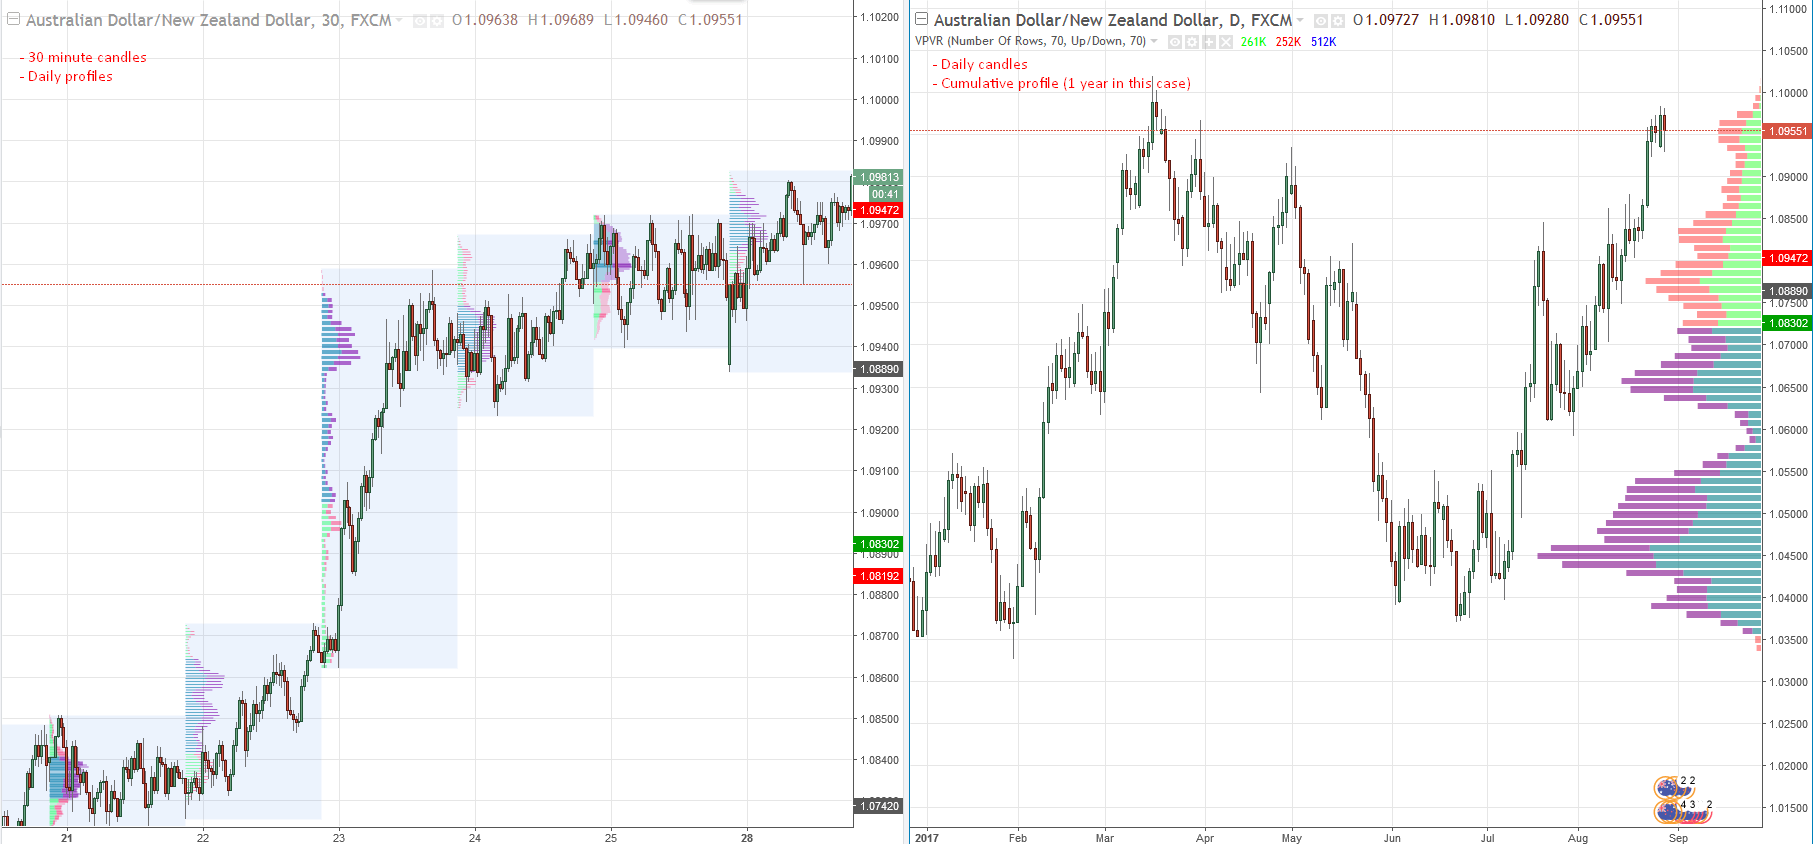
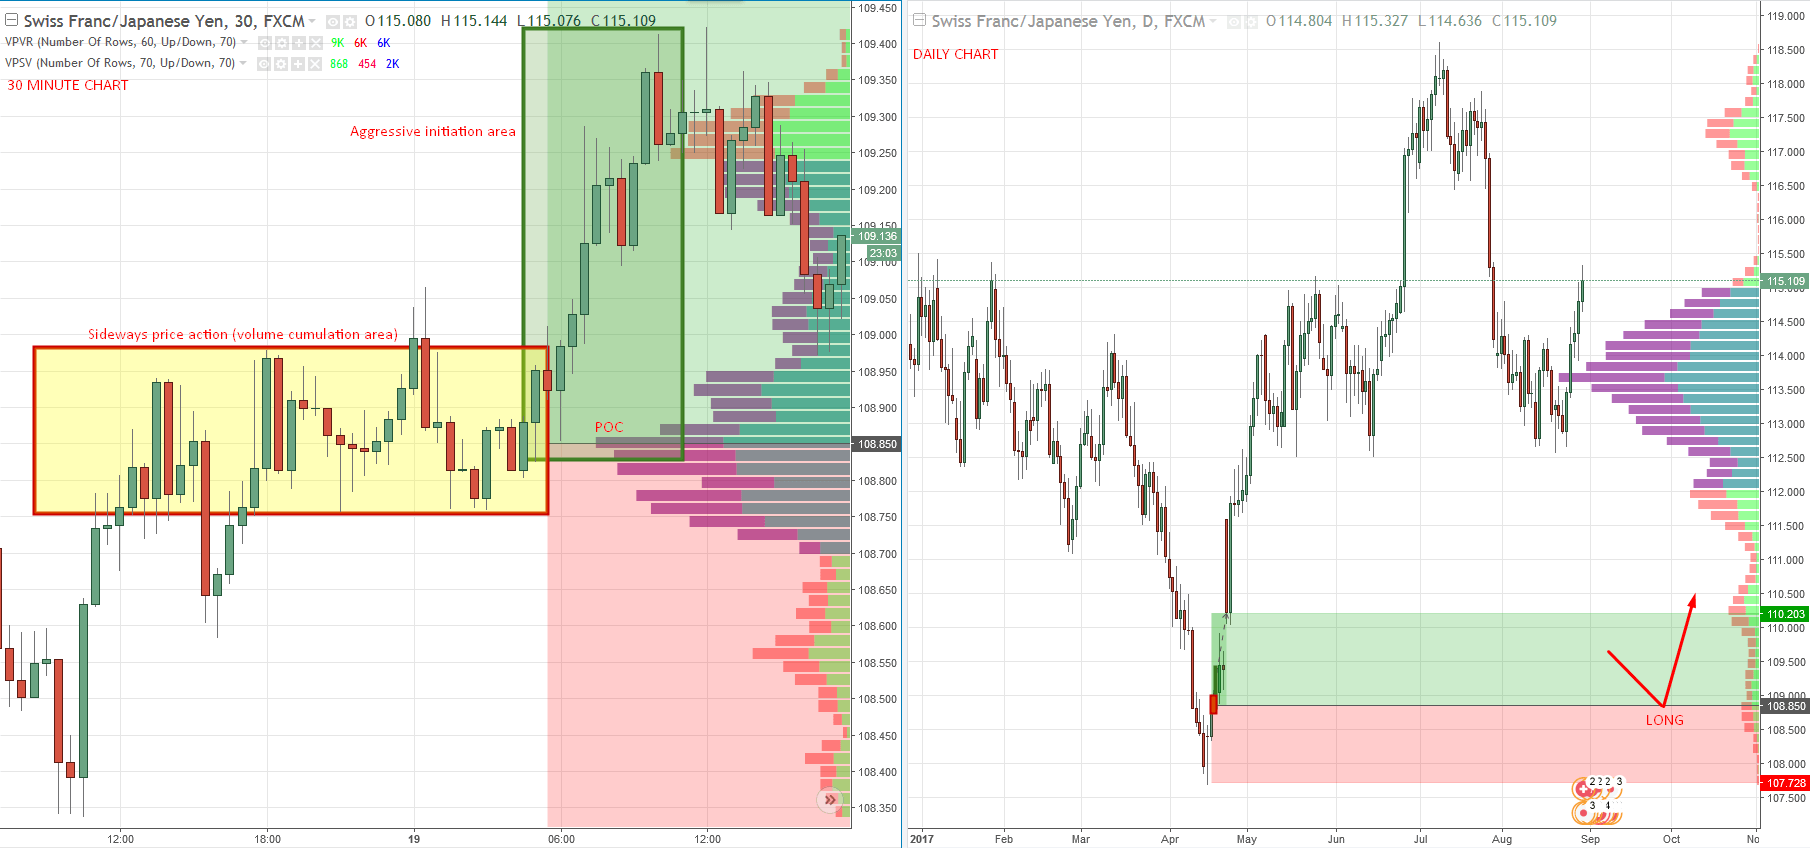
This is what your workspace should like. The left chart shows the 30-minute chart with the daily market profile. The chart on the right (the main chart) shows Daily candles with the cumulative profile for the last year (click the picture to enlarge).
Cumulative Market Profile Shape
The first thing to do when analyzing the market from a long-term point of view is to look at the shape of the long-term cumulative profile (in this case yearly). If you are not familiar with the basic shapes the profile can have, and how to trade those, please read this article: Market Profile 2 – different profiles and their application. All the examples in this article are made on daily profiles, but the logic stays the same regardless of the time frame you use.
The reason for doing this step in the first place is to see the bigger picture. When you know what the yearly profile looks like, then you can trade with the bigger picture in view. You also know what strategy you want to use and what areas you should be looking to trade from.
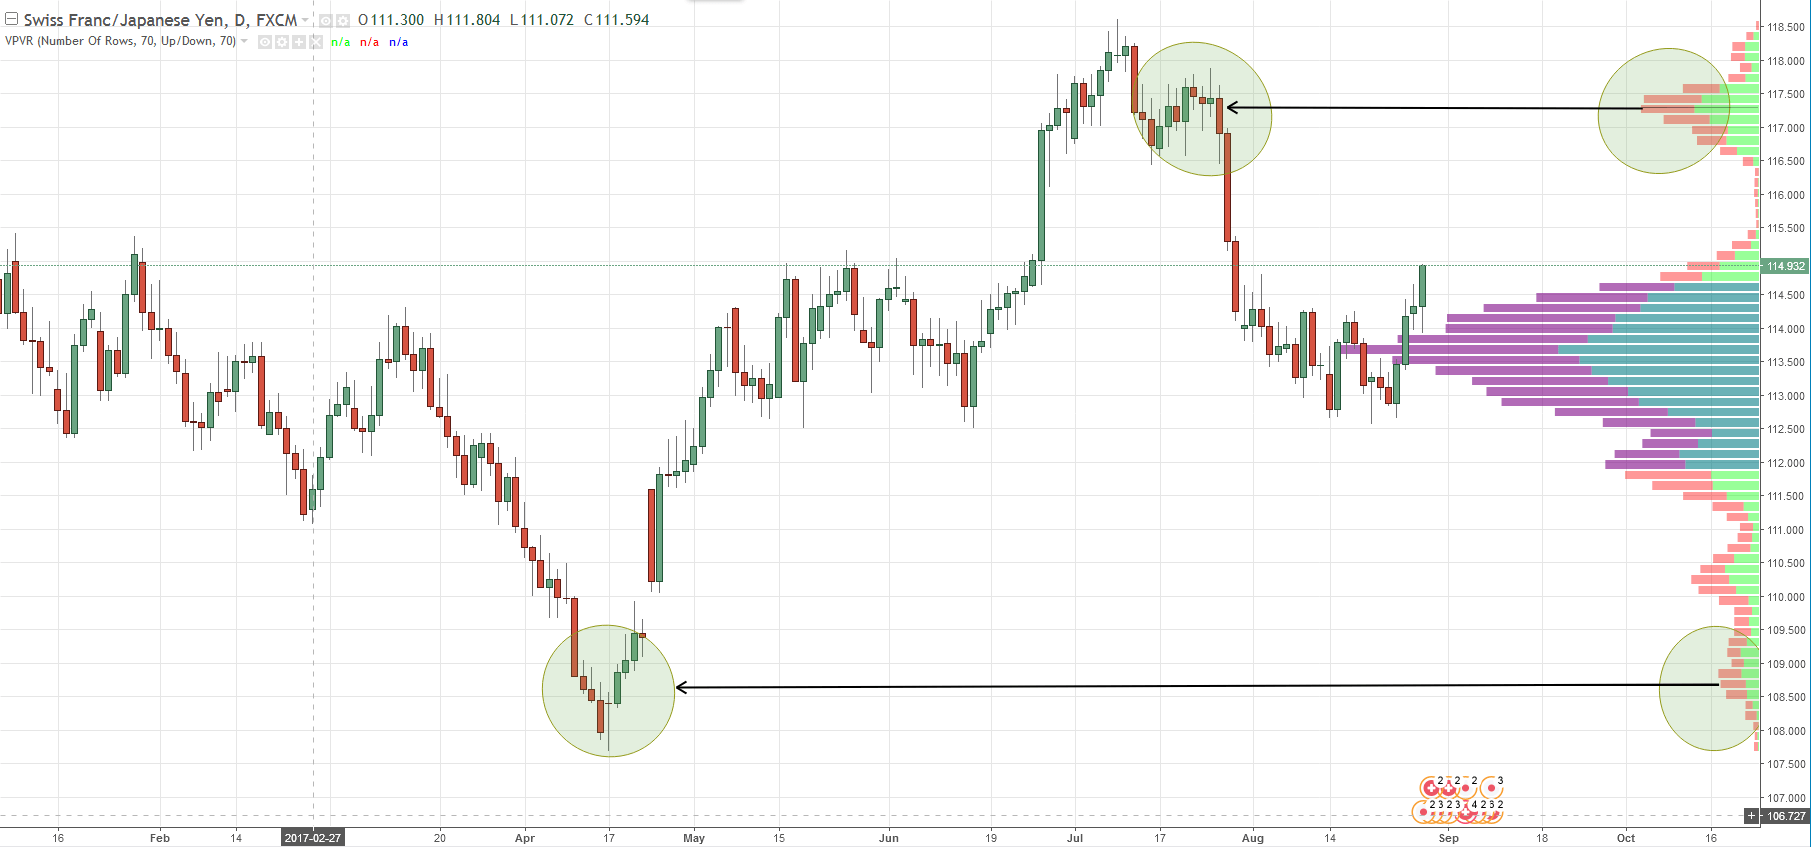
As an example, let’s look at a daily chart of the CHF/JPY. The cumulative profile of the current year is “D” shaped. For this reason, I immediately know that I want to look for both short and long swing levels to trade. Those levels should be at the extremes of this “D” shape, and the maximum potential for those trades should be a retest of the POC. I marked two potential swing trade levels in the chart below. One is a short from around 117.40; the other is a long from around 108.70.
Point Of Control (POC)
For me, the POC is the most significant information that Market Profile can give us. This is because the POC is the price point where the most volume was traded. In this case, it is a price point where the most volume throughout the year was placed. If you think about it, it really is a very significant piece of information. For example, if you have a “D” shaped profile, the POC often becomes a magnet as this is where the market was in balance. With that knowledge, you can expect that the market will have a tendency to return to this balance area.
Significant Price Action Areas
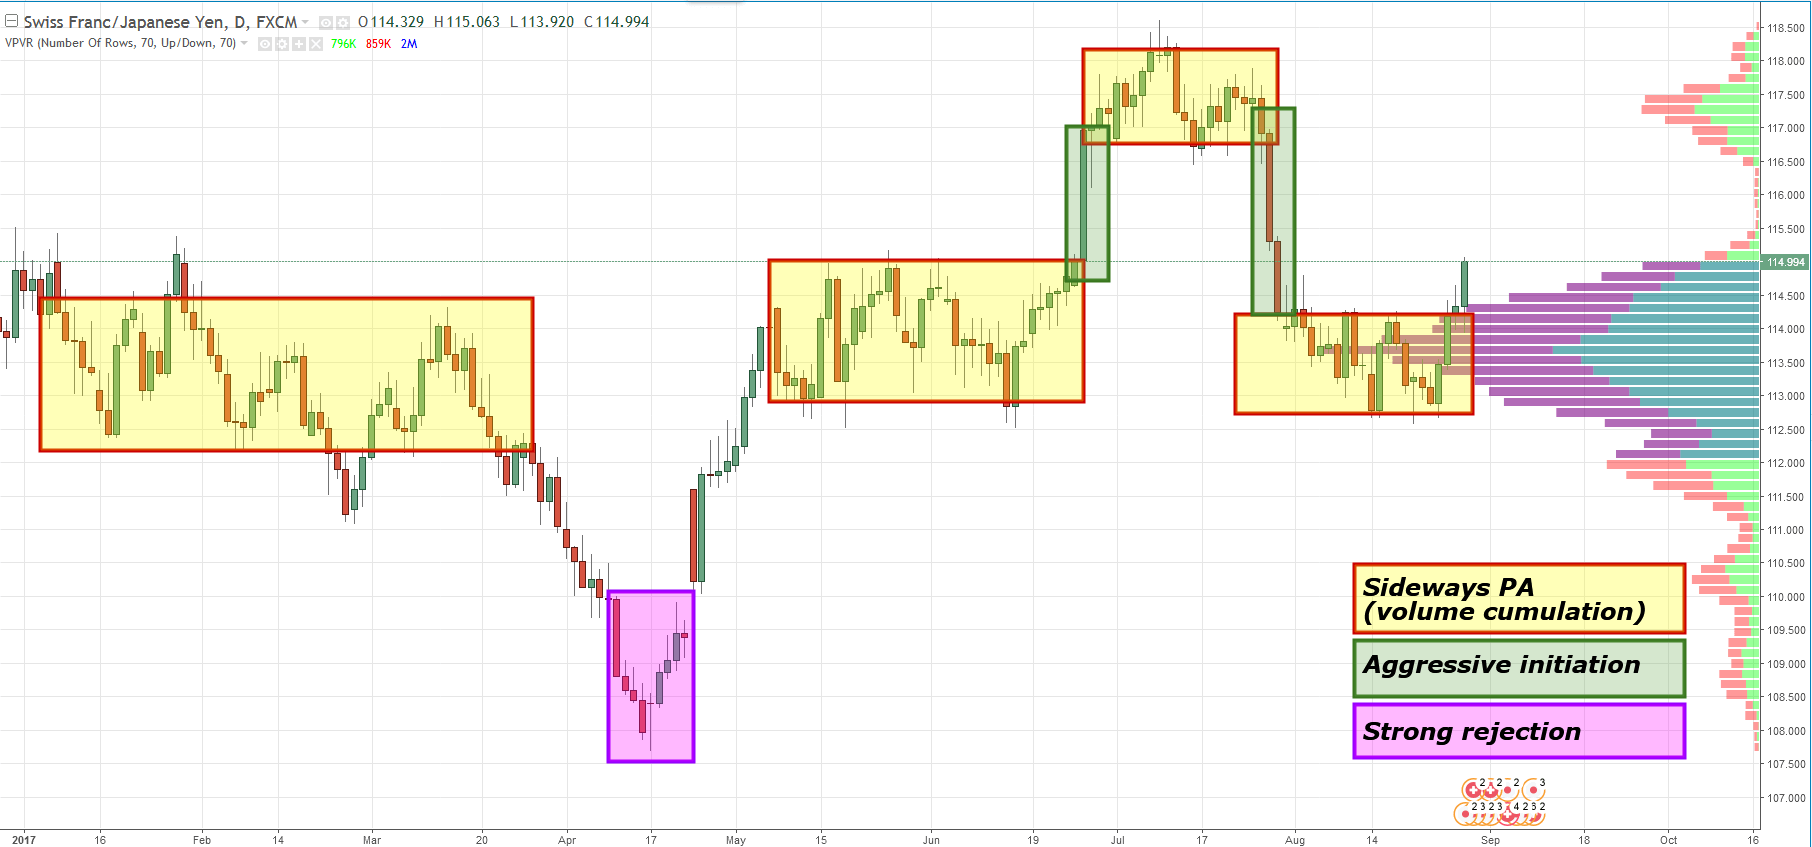
The most significant areas from a price action point of view are:
1. Sideways price action area
2. Aggressive initiation area
3. Strong rejection area
You probably know those from my Market Profile Webinar. I use those areas to make a picture of what is going on in the given market and to create my own trading levels. Let’s have a look into these in a little more detail.
- Sideways price action area – Is significant because heavy volumes are typically placed in these areas. Because heavy volumes mean big institutions, these areas indicate where institutions accumulate and build their positions.
- Aggressive initiation area – Is an area where price runs very quickly, aggressively, and without pullbacks. It usually follows areas of sideways price action. Large institutions (smart money) finish building up their positions and after that, the price is allowed to run. The direction of this aggressive initiation area shows which side of the market is in control, whether the buyers or the sellers.
- Strong rejection area – Clearly illustrates strong and aggressive buyers or sellers in a given area.
Creating Swing Trade Levels
At this step, I already know how the institutional volumes were distributed throughout the year, and I know where most of them were accumulated (POC). I also know where the most significant areas on the chart are from a Price Action point of view. The only thing that is left to do, is to create the trading levels using all this information.
At first, I create my levels using the yearly profile and the Daily price chart. Those levels can lack some precision so I look into the 30-minute chart and daily profiles. This allows me to more accurately identify where the volume is located.
Let’s have a look at the CHF/JPY example:
Because of the analysis above, I now know that I want to get long somewhere around the 108.70 area. There are 4 main reasons for this trade:
- The yearly profile is D shaped.
- This level is at an extreme of the D profile.
- There is a volume cluster visible on the yearly profile indicating institutional activity.
- There was a strong rejection of lower prices in this area.
If I zoom into the 30-minute chart, I see there was sideways volume accumulation followed by aggressive buying initiation. This allows me to mark the level much more precisely as compared to doing so from the Daily Chart. Now my long level makes sense from both the higher and lower timeframe. Here is a picture of the chart.
That’s it
So, guys, this is how I use Market Profile to swing trade high probability turning points. I suggest you try it on your own and then feel free to contact us with any questions you might have!
Happy trading!
-Dale
P.S. Here is a video that covers this whole process. Also, one extra swing level is mentioned there.
P.P.S. If you want to become a member of my Pro Forex Course and get access to the Propitiatory Market Profile Course, Daily Levels Video, Swing Trading Levels, Auto Trading EA, Member Forum, and Personal Support you are very welcome to join here: Trader Dale’s Pro Forex Course
Great material! Do you have any videos demonstrating Market Profile on MT4?
Hello and thanks!
Check this one:
https://www.trader-dale.com/weekly-forex-market-analysis-trade-ideas-18th-february-2019/
Hi Dale. Am I right in thinking that you no longer favour Market Profile because you consider Volume Profile to be superior for FX spot trading?
Yea, if you have the option of using Volume Profile then it is better than Market Profile. Cheers!