
If you want to know how to trade market rotations and trends, start with one simple truth. The market only ever does two things. It either moves sideways in a rotation, or it pushes hard in one direction in a trend. There is no third option. This is true no matter what asset you trade or what time frame you use. Once you can tell these two states apart, you stop guessing. You start reading the market like a story instead of a jumble of random candles. This article breaks down both phases in plain, simple language.
It uses the same ideas taught in the video above. You will learn why big trading institutions hide inside rotations. You will learn why heavy volume shows up there. And you will learn why a long rotation often leads to a strong trend later on. By the end, you will know how to trade market rotations and trends with more confidence, even as a total beginner. We will use simple charts, a clear table, and real examples. Nothing here should feel confusing or overly technical. No hard jargon. No long theory. Just the core lesson, broken into small steps you can use the next time you open your charts.
Table of Contents
Summary in 5 Points
- The market only does two things: it rotates or it trends.
- During a rotation, buyers and sellers agree on a fair price, and big players quietly build positions.
- Rotations often carry the heaviest trading volume, which shows up clearly on a Volume Profile.
- The longer a rotation lasts, the stronger the trend that usually follows it.
- A trend happens when one side, buyers or sellers, becomes far more aggressive than the other.
What Is a Market Rotation?
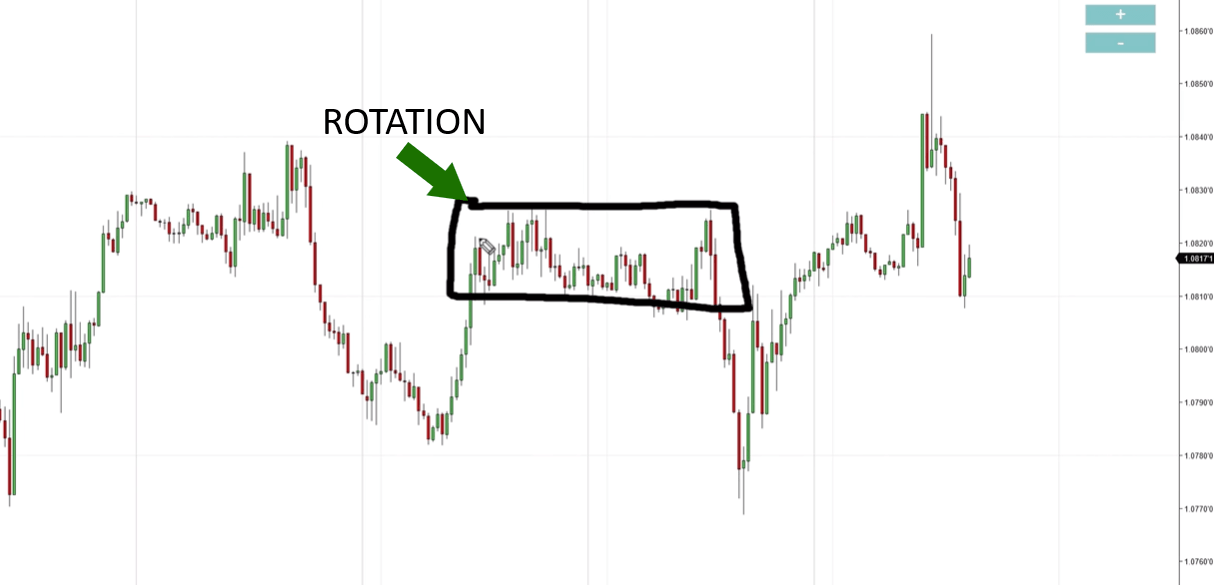
A market rotation is a period where the price moves sideways instead of running in one direction. This is actually the most common state of the market. It happens far more often than a trend. When you learn to trade market rotations and trends, the rotation is usually the first pattern to master. It shows up far more often on your charts than a strong trend does.
The Idea of a Fair Price
During a rotation, the price is telling you something important. It is telling you that buyers and sellers have found a fair price. Think of it like a busy market stall. If the seller asks too much, nobody buys. If the price drops too low, everyone rushes in to buy. Eventually, the price settles at a level where both sides are happy. That settled zone is the rotation.
Both buyers and sellers are content to keep trading in this same price area, at least for now. Nobody feels the urge to push the price sharply higher or lower. This is why a rotation is also called a zone of equilibrium. The word simply means balance. Picture a set of old fashioned scales sitting level. Neither side is heavier. That is exactly what a price rotation looks like on a chart.
Why Rotations Matter for Your Trading
This idea is worth repeating, because it is the foundation of everything else in this guide. A rotation is not the market doing nothing. It is the market doing something very specific. It is agreeing on value. Once you see rotations this way, your charts will make far more sense. You will stop asking why the price is not moving. You will start asking what the market is agreeing on right now. That shift in thinking is often the first real step traders take. It is how they begin to seriously trade market rotations and trends, instead of guessing at random entries.
Why Big Institutions Love Rotations
This section explains one of the most useful ideas in the entire video. Large trading institutions do most of their buying and selling during rotations, not during trends. Once you understand why, you will never look at a sideways chart the same way again.
How Institutions Quietly Build Positions
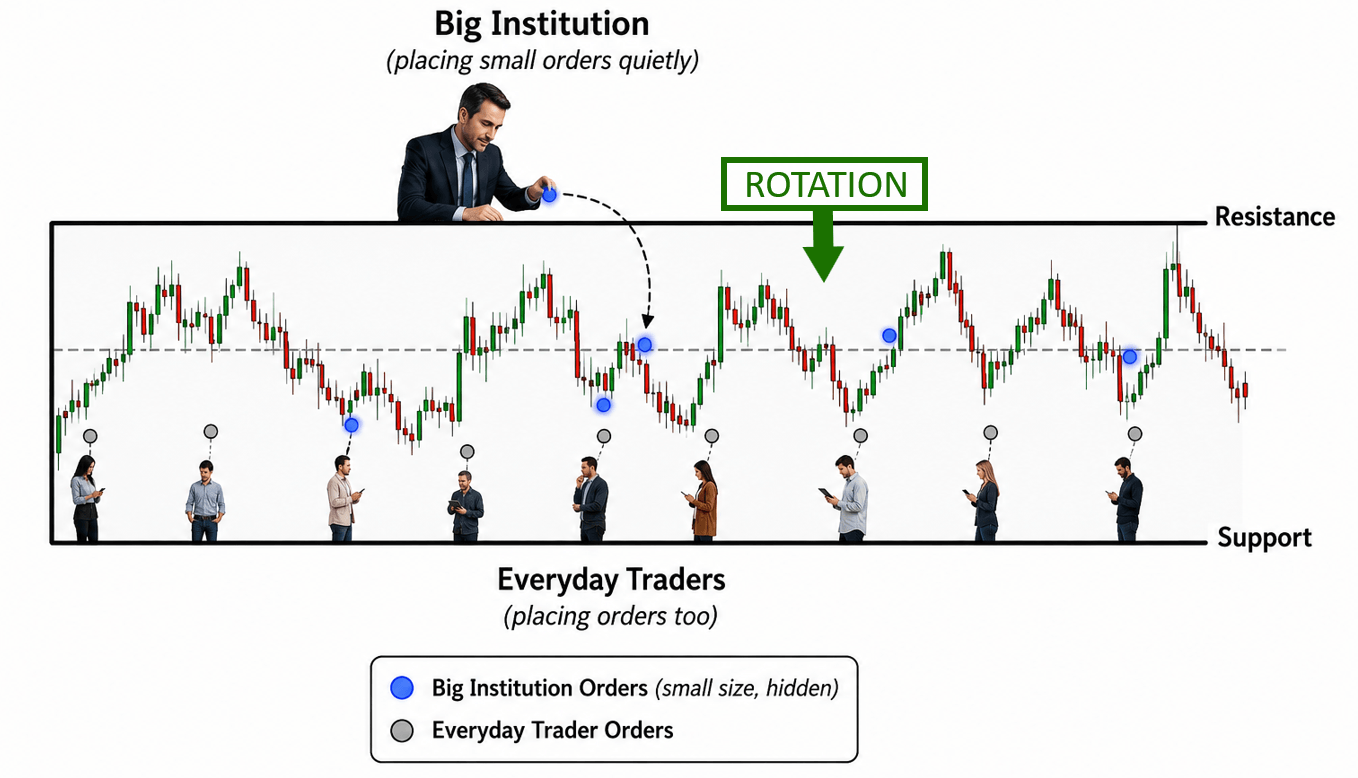
Large institutions, such as banks and big funds, control huge amounts of trading capital. They cannot simply click a button and buy everything at once. If they tried to enter a massive position in one go, the price would jump sharply before they finished buying. That would cost them a lot of money. So instead, they spread their buying or selling out over time. They do it quietly, a little at a time.
A rotation is the perfect place to do this. Because the price is moving sideways, these institutions can enter their positions without being noticed. Their orders blend in with the smaller, everyday trades happening in that same price zone. If you only glanced at the chart, you would just see normal back and forth price action. You might not see a giant player slowly building a position underneath the surface.
Liquidity: The Other Reason Rotations Work
There is a second reason institutions prefer rotations, and it is liquidity. Liquidity simply means there are enough buyers and sellers around to trade with. Since the market is balanced during a rotation, someone is always on the other side of the trade. A big institution needing to buy a large amount can find enough sellers willing to sell at that fair price. This would be much harder during a fast moving trend. In a trend, one side of the market can disappear quickly.
So when you learn to trade market rotations and trends, remember this simple rule. Heavy, quiet buying or selling during a sideways period is often a sign of bigger players positioning themselves. They need time and they need liquidity, and a rotation gives them both. This is exactly why professional traders pay close attention to rotations. They do not treat them as boring price action to ignore.
How to Spot Heavy Volume During a Rotation
One of the clearest signs of institutional activity is trading volume. This section shows you how to read it using a simple tool called the Volume Profile.
Understanding the Volume Profile Tool
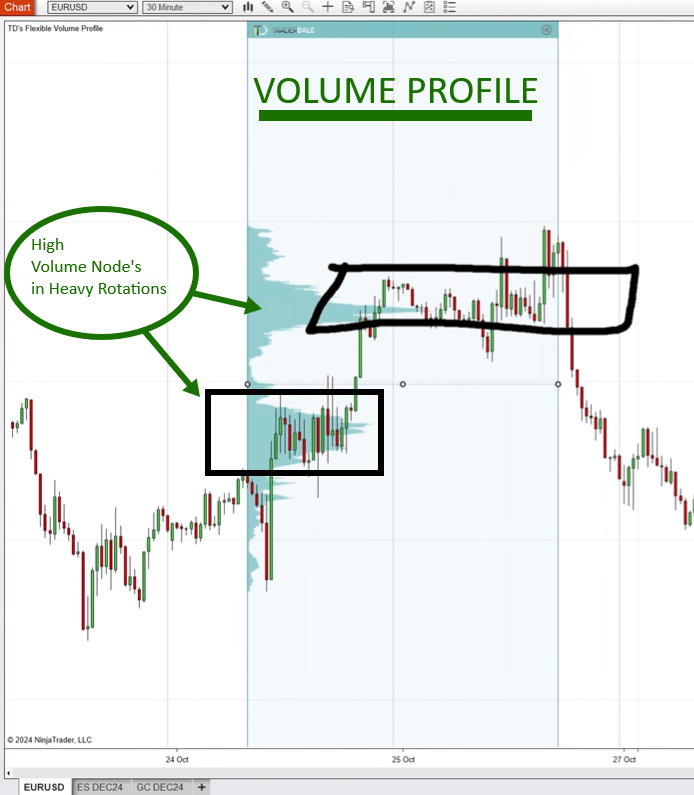
The Volume Profile is a chart tool that shows how much trading volume happened at each price level. It does not just show volume over time, like a normal chart. Instead of a bar for every hour or every day, it draws a sideways bar for every price level. The wider that sideways bar is, the more volume was traded at that price.
Here is the key lesson from the video. The volume traded during rotations is often the heaviest volume on the entire chart. If you place a Volume Profile over a rotation zone, it will usually bulge out much wider than over a trending move. This matches what we just learned about institutions. They need time to build large positions. So more total volume naturally gets traded in that sideways zone.
Rotation Volume vs Trend Volume at a Glance
Think of it like a busy highway during rush hour, compared to an open road late at night. The rotation is rush hour. Lots of cars, meaning lots of trades, move through that same stretch of road. A trend moves fast and covers a lot of distance quickly. But fewer total trades happen at each price along the way.
Here is a simple table to help you see the difference at a glance.
Feature | Rotation | Trend |
Price direction | Sideways | One clear direction |
Trading volume | Usually heavy | Usually lighter per level |
Institutional activity | Building positions quietly | Pushing price aggressively |
How common it is | Very common | Less common |
Trader goal | Watch and prepare | Follow the direction |
When you check the Volume Profile and see a wide bulge, you are looking at an important price area. This is a zone worth remembering. Price often returns to test these heavy volume areas again later. Reading this tool well is one of the most practical skills you can pick up. It helps you properly trade market rotations and trends, instead of just watching candles move without context.
What Is a Market Trend?
Now that rotations make sense, look at the second and final state of the market. This is the trend. A trend happens far less often than a rotation. But it is the phase traders often get most excited about, because this is where the big, fast price moves happen.
Why Trends Happen: Aggressive Buying and Selling
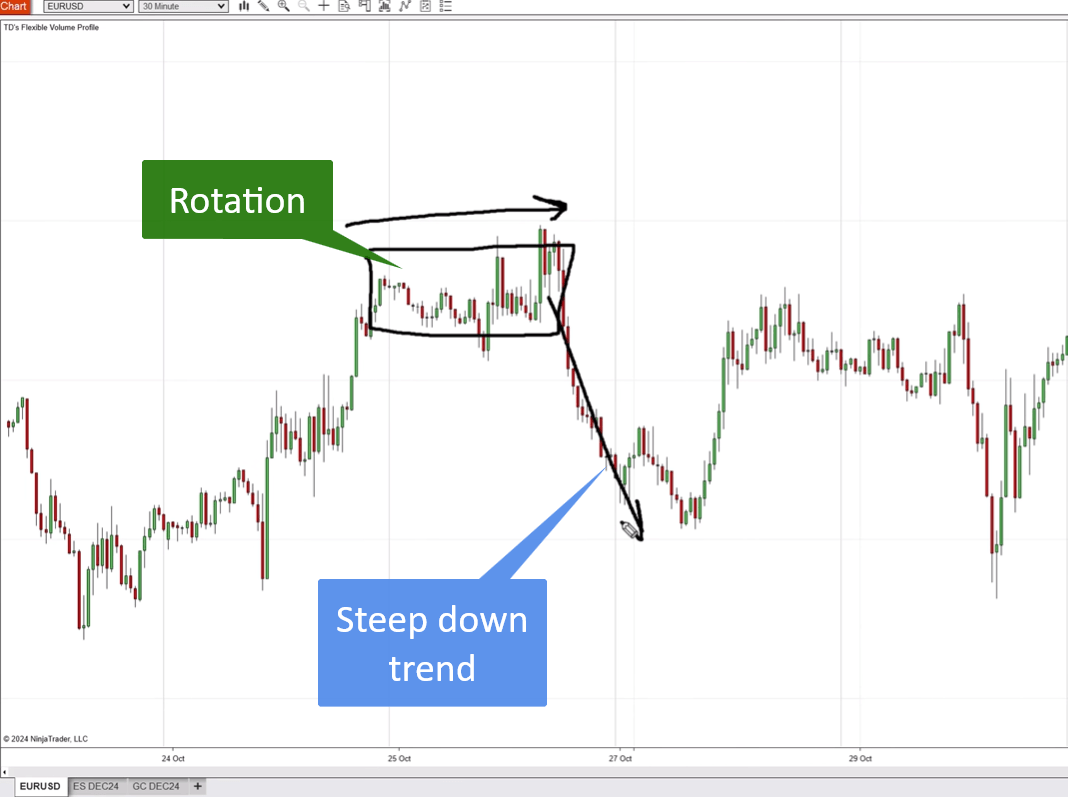
A trend tells you something very different from a rotation. Instead of buyers and sellers agreeing on a fair price, a trend shows an imbalance. One side has become much more aggressive than the other. In a downtrend, sellers are far more aggressive than buyers. In an uptrend, buyers are far more aggressive than sellers. This imbalance is what pushes the price steeply in one direction.
How does this aggression actually show up on the chart? Sellers, in a downtrend, are not just casually offering to sell. They are hitting the market with market sell orders. This means they want out immediately, at whatever price is available. That urgency is what causes the price to drop steeply, instead of drifting down slowly. The same logic applies in reverse for an aggressive uptrend. There, buyers use market buy orders to get in right away, rather than waiting for a better price.
It helps to picture the difference this way. A rotation is like two people calmly negotiating a price at a market stall. A trend is like a crowd rushing toward the exit doors when a fire alarm goes off. Nobody is calmly negotiating anymore. Everyone wants out, or in, right now. That urgency creates the steep, fast price move you see on the chart.
The Emotional Side of Trading a Trend
This is also why trends often feel more emotional to trade than rotations. Because price is moving quickly, traders often feel fear of missing out. They may also feel panic about losing money. These emotions can lead to poor decisions. Understanding the mechanics behind a trend can help you stay calmer. It helps you see the aggressive buying or selling that is really driving the move. When you grasp why a trend is happening, you are far better equipped to trade market rotations and trends with a level head, instead of reacting purely on emotion.
The Link Between Rotation Length and Trend Strength
This next idea is one of the most valuable takeaways from the whole lesson, so it earns its own section. There is a direct relationship between how long a rotation lasts and how strong the trend that follows it will be.
The Water Balloon Analogy
The general rule is simple. The longer the rotation, the stronger and longer the trend that usually follows it. This makes sense once you connect it to what we learned about institutions. They use rotations to quietly build large positions. The longer the rotation lasts, the more time they have to build an even bigger position. A bigger position means more fuel for an aggressive move once the trend finally begins.
Think of it like filling up a water balloon. A short rotation is like filling the balloon for just a few seconds. When you let go, it will not fly very far. A long rotation is like filling that same balloon for several minutes. When you finally let go, there is far more pressure built up inside. It shoots off with much more force. The length of the rotation is directly tied to the power behind the eventual trend.
Using This Pattern to Plan Your Trades
This is a useful piece of information for planning your trades. Suppose you notice a rotation that has lasted an unusually long time, compared to recent rotations on the same chart. Pay close attention. This could be a sign that a large position has been built. Once the trend begins, it may be a bigger and longer move than usual.
Of course, this is a general guide, not a guarantee. Markets do not follow rigid rules every time. But this pattern shows up often enough to be worth watching for. Combine it with the Volume Profile tool from earlier. Now you have two strong clues working together. A wide Volume Profile shows heavy volume. A long rotation shows plenty of time for that volume to build. That is the entire point of learning to trade market rotations and trends, rather than reacting after the move has already happened.
Zooming In vs Zooming Out: Two Ways to Read the Same Chart
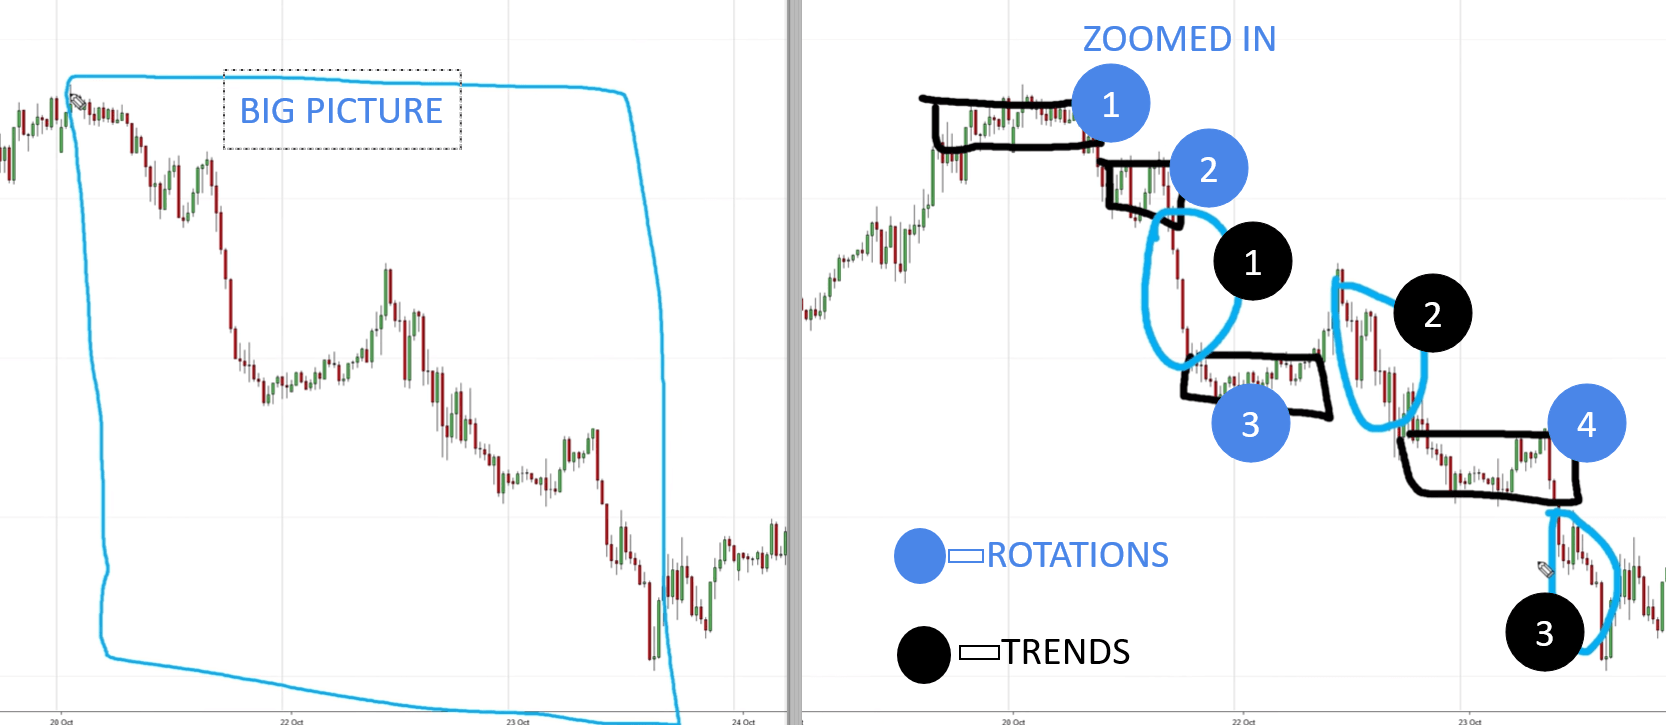
Here is a helpful lesson that ties everything together, and it comes directly from the video. The exact same price chart can be described in two different ways. Both ways are equally correct, depending on how closely you look.
The Big Picture View
If you zoom out and look at the big picture, a long price move down might look like one giant downtrend. It runs from start to finish. That is a perfectly valid way to describe it. Nothing is wrong with that view at all.
But if you zoom in and look more closely, you might notice something else. That “one big downtrend” was actually made up of several smaller pieces. It might have looked more like a rotation, then another rotation, then a downtrend. Then another rotation, and then another downtrend. This detailed view breaks the same overall move into smaller chapters. Each chapter has its own small story.
The Detailed, Zoomed In View
Both descriptions are correct at the same time. Neither one is wrong. The only difference is the level of detail you choose for your analysis. A beginner trader might prefer the simple, zoomed out view. It is easier to understand. A more advanced trader might prefer the zoomed in, detailed view. It can reveal more precise entry and exit points.
There is no single correct answer here. It depends on your own trading style. It also depends on how detailed you want your analysis to be, and how much time you have to study your charts each day. What matters most is that you now understand both rotations and trends. You can recognize them at any zoom level, on any chart, in any market you follow. This flexibility is exactly what makes it possible to trade market rotations and trends on any time frame you choose, from long term investing down to short term day trading. Try both views for yourself. Look at one of your recent charts as a single big trend, then look again and break it into smaller rotations and trends. You will likely notice new details the second time around.
Conclusion
Learning to trade market rotations and trends comes down to recognizing two simple states of the market. A rotation shows a period of balance. Buyers and sellers agree on a fair price. Big institutions often quietly build their positions there, using heavy volume. A trend shows a period of imbalance. One side becomes far more aggressive than the other and pushes price steeply in one direction.
Once you can spot the difference, your charts stop feeling random. They start telling a clear, connected story. Remember the key clues from this guide. Watch for heavy volume on the Volume Profile during sideways price action. Pay attention to how long a rotation lasts, since longer rotations often lead to stronger trends. And remember that you can view any chart from a simple, big picture angle, or a more detailed, zoomed in angle. Both views are perfectly valid.
These are not complicated ideas once you break them down. But they form the foundation of a much deeper understanding of how markets truly move. Keep practicing spotting these two states on your own charts. Over time, reading price action will feel far more natural and far less confusing. Start small. Pick just one chart today and try to label each section as either a rotation or a trend. That single habit, repeated often enough, is how real chart reading skill is built over time.
FAQ
1. What is the difference between a market rotation and a trend?
A rotation is a sideways period where buyers and sellers agree on a fair price. A trend is a period where one side becomes much more aggressive and pushes the price steeply in one direction.
2. Why do big institutions trade during rotations instead of trends?
Institutions need time and liquidity to build large positions without moving the price too much. A rotation gives them both. It lets them enter quietly, without drawing attention.
3. Does a longer rotation always mean a stronger trend will follow?
Not always, but it is a common pattern. The longer a rotation lasts, the more time institutions have had to build positions. This often leads to a stronger and longer trend once it begins.
Next Steps:
If this guide helped you understand how to trade market rotations and trends, there is more to learn. Watch the full video above for a visual walkthrough of these examples on a real chart. Then explore the related articles below to keep building your skills. You can also check out the full trading course and indicator tools to take your learning further.

Very Help full post thanks for sharing this
Great guide! Market rotations and trends can be difficult to understand, but this explanation makes the concept much easier. I especially like the focus on identifying trend changes before making trading decisions. Understanding market structure and staying patient can help traders avoid chasing price movements.