
If you have ever wondered how big trading institutions decide where to place their trades, this article will show you exactly that. The Volume Profile pullback strategy is a simple method that combines two powerful tools: Volume Profile and Anchored VWAP. Volume Profile shows you where the heaviest trading activity happened on a chart. Anchored VWAP then tells you the fair price from that important zone. When you combine both tools, you get a clear picture of where big traders are likely to defend their positions.
This strategy works because large institutions do not hide their footprints. They leave clues in the form of heavy volume. Once you learn to spot these clues, you can follow the same logic that professional traders use every day. You do not need complicated indicators or years of guessing. You only need to understand two things: where the volume was heavy, and where the trend began.
In this guide, you will learn how to identify strong rotation zones, how to anchor your VWAP correctly, and how to enter pullback trades with a clear plan. We will also walk through real chart examples so you can see the strategy in action. By the end, you will have a repeatable process you can apply to any market.
Five Key Points
- Volume Profile reveals zones where big trading institutions were active.
- A strong rotation followed by a strong trend marks the important zone to study.
- Anchor your VWAP to the last candle of the rotation, which usually starts the trend.
- Once price moves away from the anchored VWAP, wait for a pullback to enter your trade.
- The anchored VWAP often flips from resistance to support, or the other way around, once price breaks through it.
Table of Contents
What Is the Volume Profile Pullback Strategy
The Volume Profile pullback strategy is a way of trading that looks for places where heavy volume was traded before a strong trend began. Instead of guessing where the market will turn, you let the volume tell you where big institutions were building their positions.
Here is the basic idea in simple terms. Markets move in cycles of rotation and trend. During a rotation, price moves sideways while large traders quietly build their positions. Once those positions are built, a strong trend begins. Volume Profile helps you spot the rotation phase because it shows exactly where trading volume was heaviest.
Once you find that zone, you anchor a VWAP, which stands for Volume Weighted Average Price, to the candle where the rotation ended and the trend began. This anchored line then acts as a fair price marker. When price pulls back to that line later, it often reacts, because many traders are watching the same level.
This approach is popular because it does not rely on guesswork. It relies on visible, measurable data. You can see exactly where the volume was heavy, and you can see exactly where the trend started. Once you understand this simple relationship, you can apply it to any chart, in any market, and at any time frame.
Step One: Finding Heavy Volume Zones With Volume Profile
The first step in the Volume Profile pullback strategy is learning to spot rotation zones where heavy volume occurred. This is the foundation of the entire method, so it deserves careful attention.
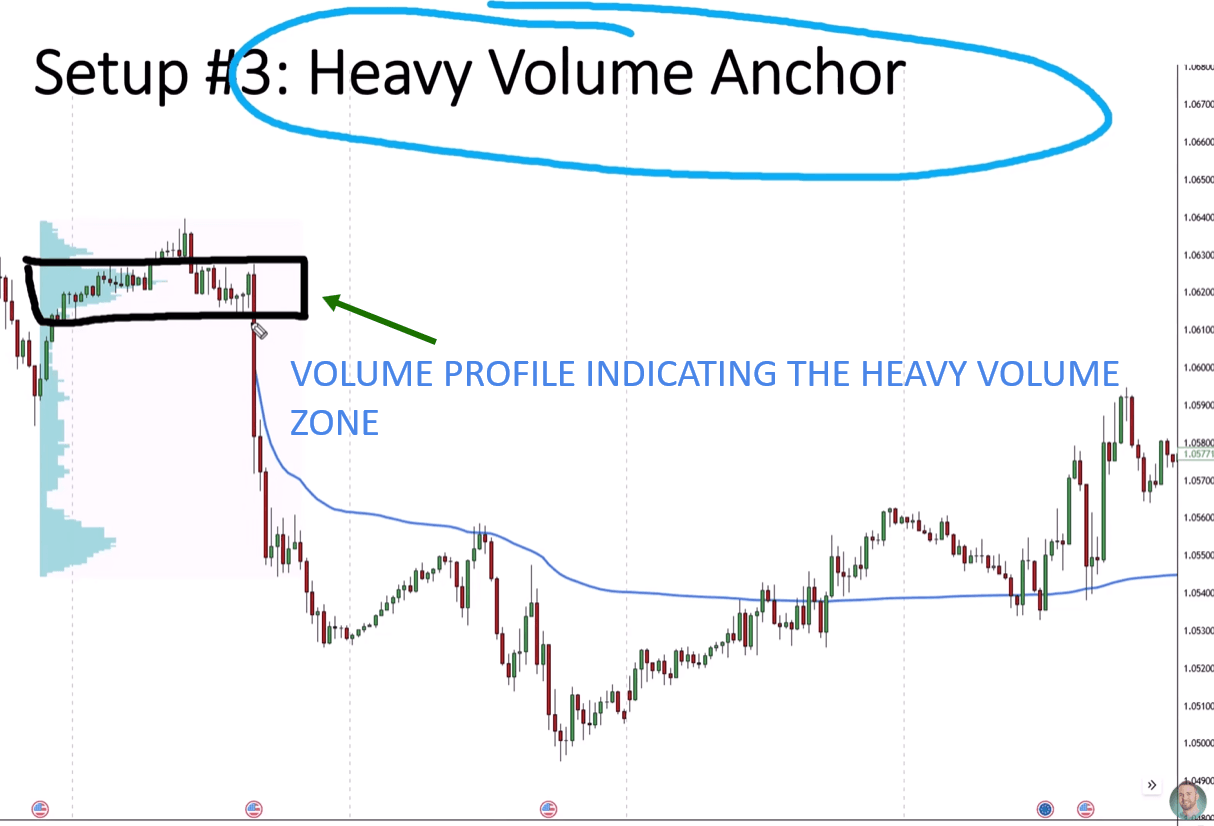
Volume Profile is a tool that displays how much volume was traded at each price level, rather than at each point in time like a normal chart. When you look at a Volume Profile chart, you will notice thick areas and thin areas. The thick areas show where a large amount of trading took place. The thin areas show where price moved quickly with little resistance.
You are looking for a specific pattern. First, price should move sideways in a rotation. During this rotation, the Volume Profile should show heavy trading activity. This tells you that big trading institutions were active in that price range. Remember, large institutions cannot buy or sell all at once without moving the market too much. So they build their positions slowly, over many candles, which creates this rotation with heavy volume.
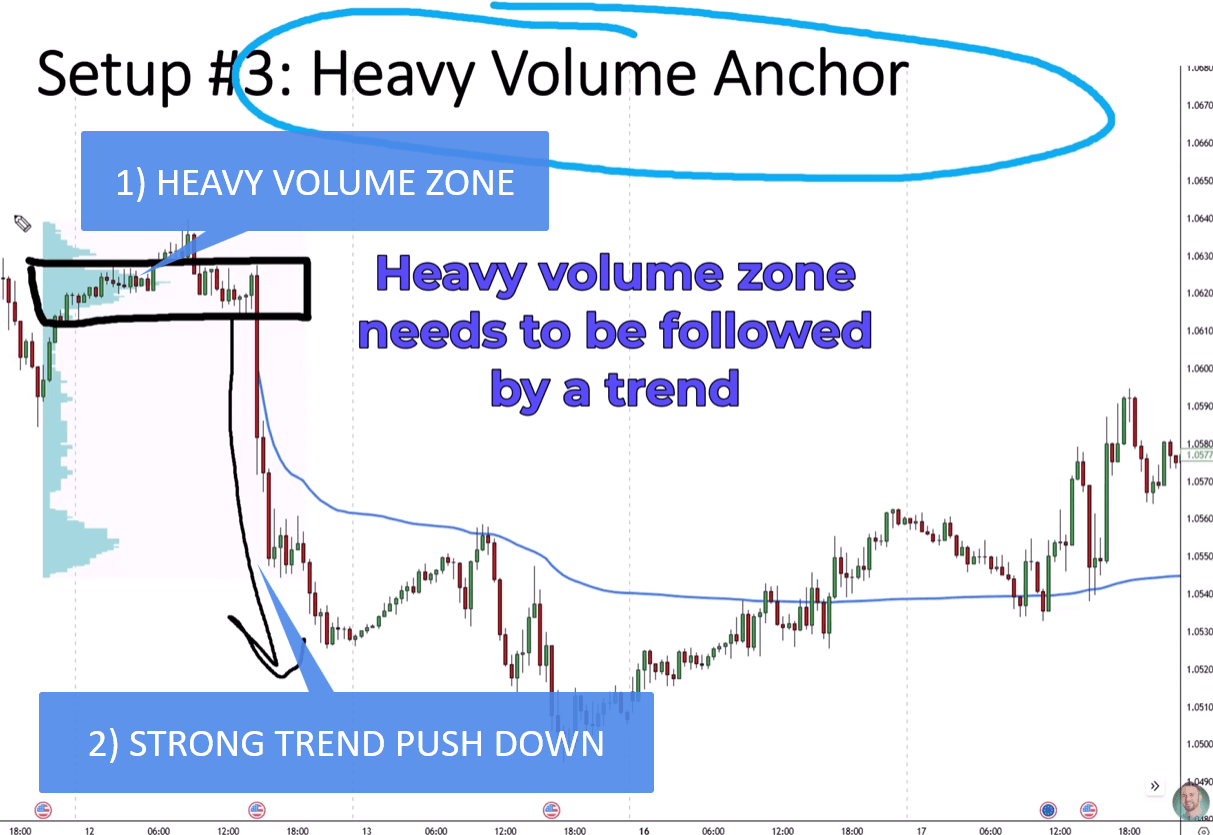
Second, this rotation must be followed by a strong trend. The strength of the trend confirms that the rotation was not random. It confirms that big players were indeed accumulating positions and then pushed price firmly in one direction once they were ready.
What to Look For on the Chart
When scanning charts for this setup, keep these points in mind:
- A clear sideways rotation, not just a single candle
- A visibly thick Volume Profile bar within that rotation
- A strong trend that begins right after the rotation ends
- The final candle of the rotation, which often marks the true start of the trend
This combination is what separates a random price swing from a genuine institutional footprint. Once you get comfortable spotting this pattern, you will start seeing it on almost every chart you study. It becomes second nature after enough practice, and it forms the base for the next step, which is anchoring your VWAP correctly.
Step Two: Anchoring VWAP to the Right Candle
Once you have found your heavy volume rotation zone, the next step is anchoring your VWAP. This step turns your observation into an actual trading tool you can use on the chart.
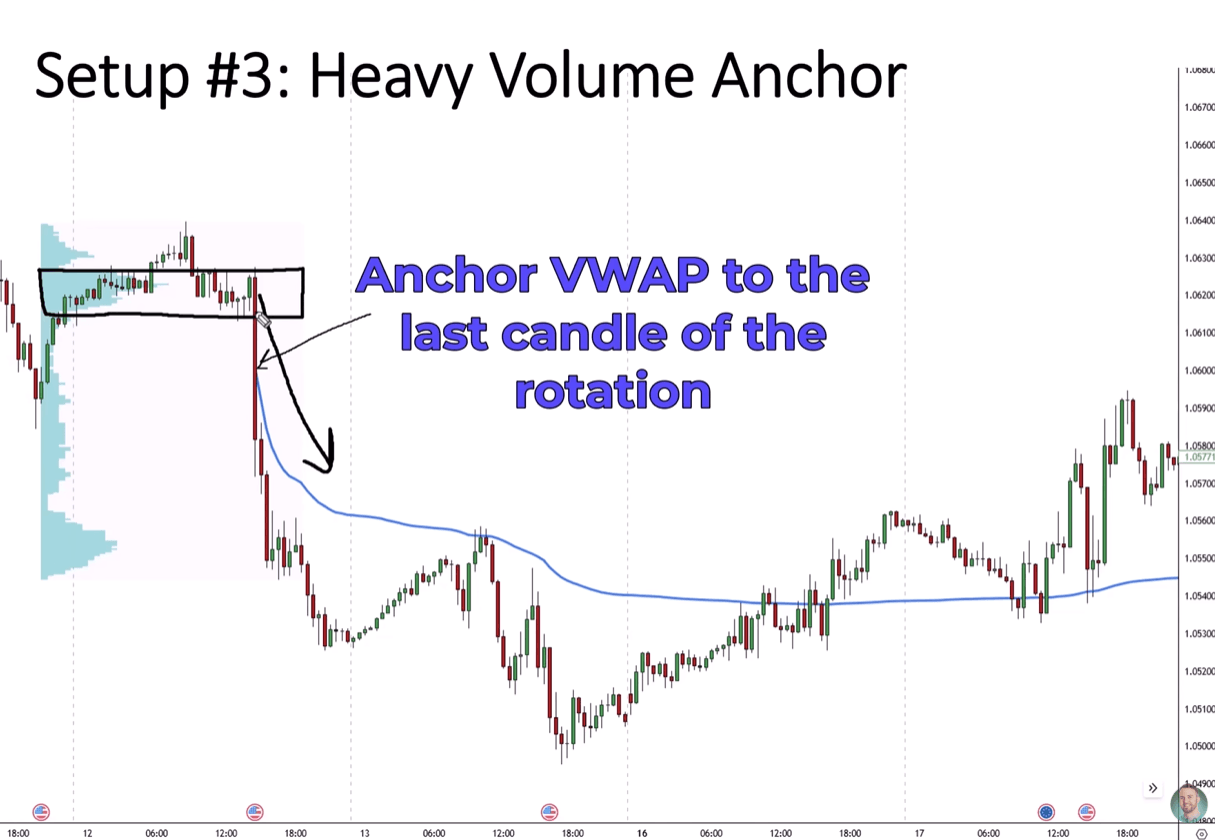
Anchored VWAP calculates the average price traded, weighted by volume, starting from a specific candle you choose. Unlike a normal VWAP that resets every day, an anchored VWAP starts wherever you place it and continues from that point onward. This makes it perfect for marking the fair price from an important zone.
So, which candle should you choose? You want to anchor the VWAP to the last candle of the rotation, which is usually the same candle where the strong trend begins. In many cases, this is a large, obvious candle that breaks away from the sideways rotation. If the rotation ended with a big red candle that started a sell off, that is your anchor point for a short setup. If it ended with a big green candle that started a rally, that is your anchor point for a long setup.
Do Not Worry About Perfect Precision
A common concern for new traders is picking the exact right candle. The good news is that you do not need to be perfectly precise. If you anchor the VWAP to a candle slightly before or after the ideal one, the line will not change dramatically. This means you have some flexibility, and you should not feel pressured to find the one exact perfect candle every time.
The reason this anchor point matters so much is simple. Big trading institutions were accumulating their positions in that zone. Many other traders also watch this same area, because it aligns with where the trend truly began. When enough traders are watching the same level, that level becomes far more powerful, because it creates a shared reference point for the whole market.
Step Three: Trading Pullbacks to the Anchored VWAP
Now that your VWAP is anchored correctly, you can start looking for actual trade entries. This is where the Volume Profile pullback strategy becomes actionable.
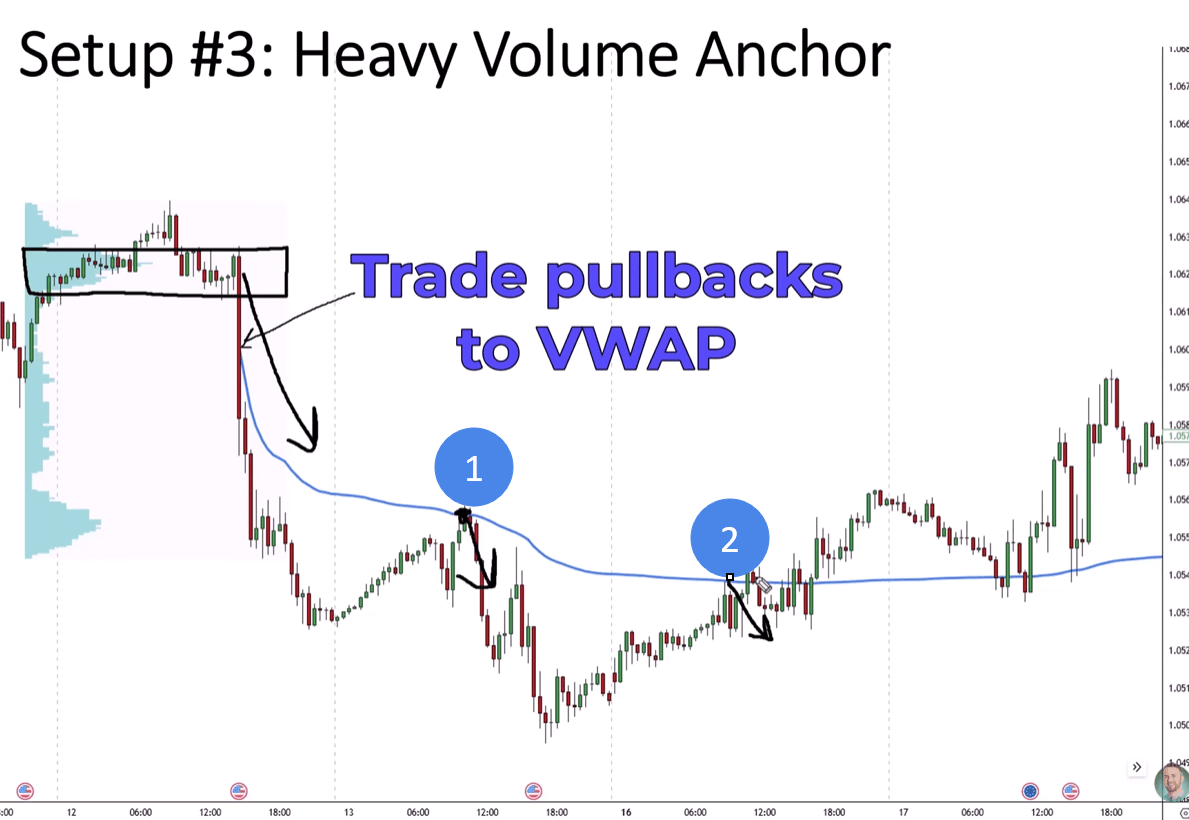
The core idea is simple. The anchored VWAP represents a fair price since the important zone you identified. When price moves away from this VWAP and then returns to it, that return is your pullback opportunity. Buyers want to buy at a fair price, and sellers want to sell at a fair price, so this level tends to attract trading activity.
Here is how it works in practice. If you anchored your VWAP to a candle that started a downtrend, you are looking for short trades. Wait for price to rally back up toward the VWAP line, then look for a short entry as price reacts to that level. If you anchored your VWAP to a candle that started an uptrend, you do the opposite. Wait for price to dip back down toward the VWAP line, then look for a long entry.
When to Stay Out of the Market
There is one important rule to remember. When the market is rotating sideways instead of trending, VWAP pullback setups do not work well. During these rotation periods, it is best to stay patient and avoid forcing trades. Wait for a clear directional move away from your anchored VWAP before you start watching for pullback entries again.
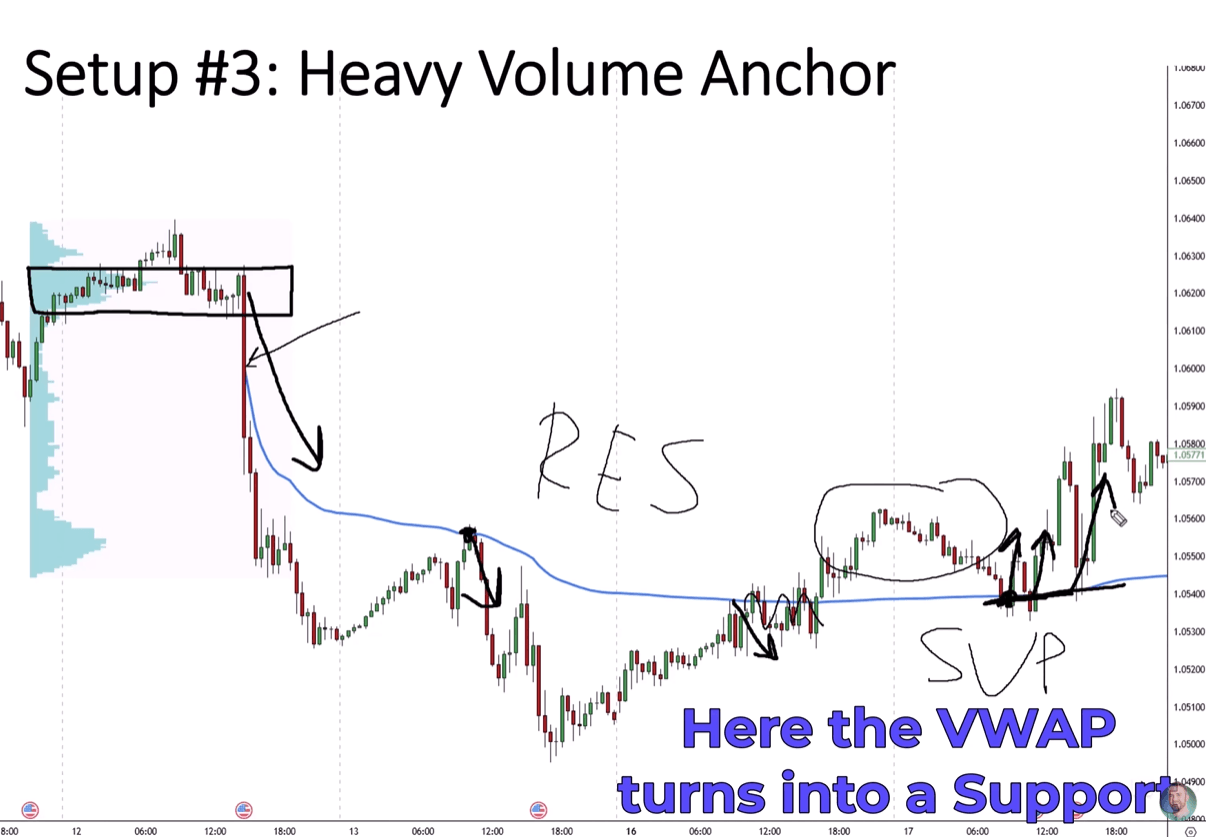
You will also notice an interesting shift once price breaks through the VWAP level. A line that acted as resistance can turn into support once price closes above it. Similarly, a line that acted as support can turn into resistance once price closes below it. This flip happens because the meaning of fair value changes once the market accepts a new direction. Traders who understand this shift can use it to their advantage by watching for the first pullback after the level flips.
Real Chart Examples of This Strategy
Seeing real examples makes this strategy much easier to understand. Let us walk through three scenarios that show how the Volume Profile pullback strategy plays out on an actual chart.
Example One: Short Trade After Resistance Flip
In this scenario, a rotation with heavy volume is followed by a strong downtrend. The VWAP is anchored to the large red candle that starts the sell off. Price pulls back to this VWAP twice, giving two short opportunities. Later, as the trend shifts and price starts moving above the VWAP, that same line turns into support instead of resistance. Traders can then look for long entries on pullbacks to this new support.
Example Two: Short Trade in a Strong Downtrend
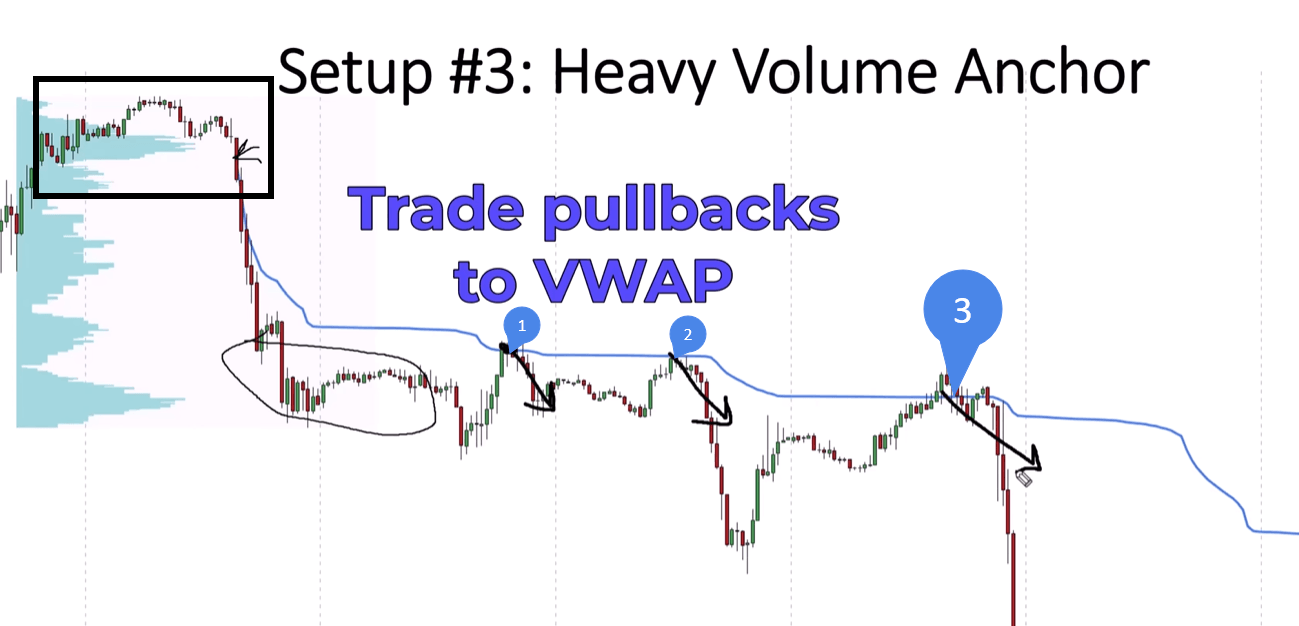
In the second scenario, another heavy volume rotation appears, followed immediately by a strong downtrend. The VWAP is anchored to the candle that begins the sell off. As price rallies back toward the VWAP on three separate occasions, each pullback offers another short entry. This example shows how one anchored VWAP can provide multiple trade opportunities over time, as long as the trend remains intact.
Example Three: Patience During Low Volatility Sessions
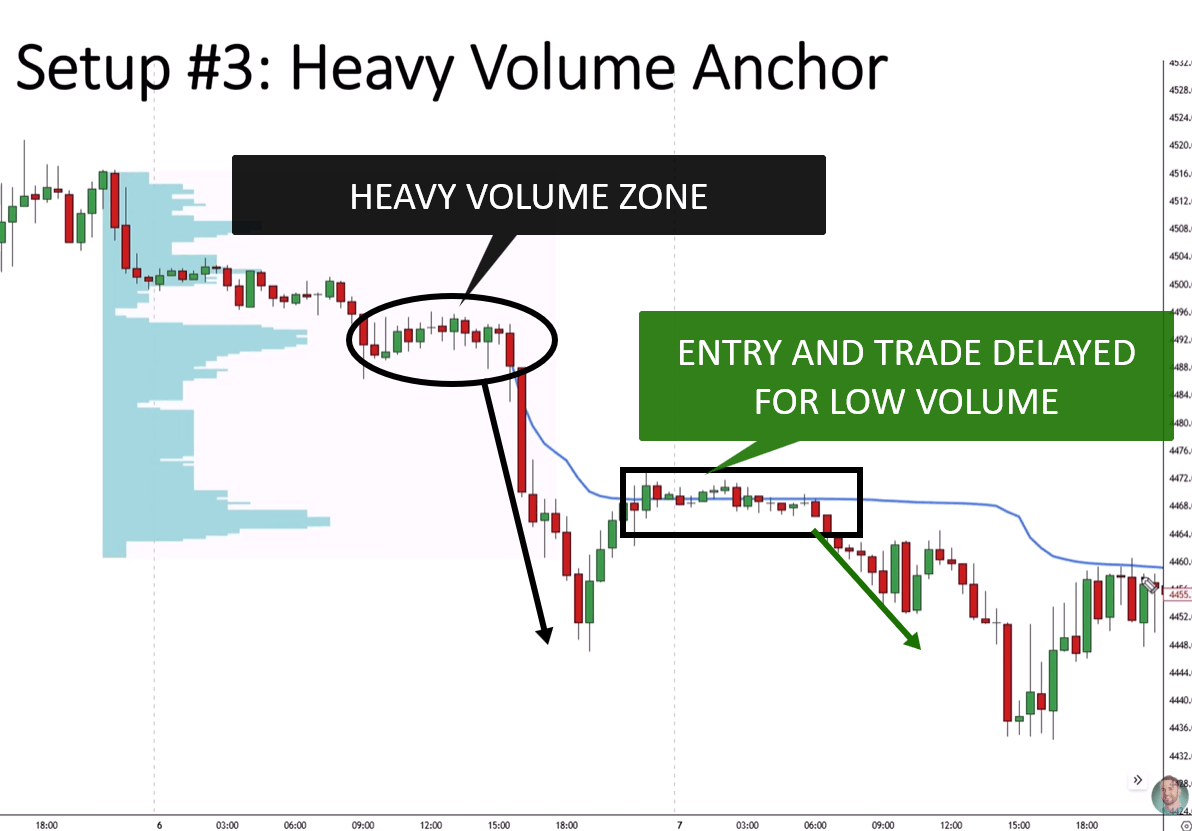
The third example includes an important lesson about patience. A small rotation with heavy volume is followed by a strong sell off. Price pulls back to the anchored VWAP, but during this particular session, known as the Asian session, volatility and liquidity are lower than usual. This means price reacts more slowly. A trader holding this position may need to wait a couple of hours for the setup to develop fully. Staying patient here can be the difference between exiting too early and capturing the full move. A second pullback to the same VWAP later offers another short opportunity in the same trend.
Why This Works: The Psychology of Big Traders
Understanding the psychology behind this strategy helps you trust it during real trading. Big trading institutions cannot enter or exit the market instantly without causing major price swings. Instead, they build positions gradually, which creates the rotation zones you learned to identify with Volume Profile.
Once these institutions have built their positions, they have a strong incentive to defend that price zone. If price returns to their average entry price, marked by the anchored VWAP, they often add to their positions or defend their profits. This behavior creates the reactions you see at pullback levels.
This is also why the strategy tends to work across different markets and time frames. The underlying psychology, large traders accumulating positions and defending fair value, remains the same whether you are trading currencies, stocks, or commodities. Once you understand this logic, the strategy stops feeling like a random set of rules and starts feeling like a window into how the market actually behaves.
Common Mistakes to Avoid
Even a simple strategy can fail if applied incorrectly. Here are mistakes to watch for when using the Volume Profile pullback strategy.
Mistake | Why It Hurts Your Trading | Simple Fix |
Anchoring VWAP to a random candle | Line does not reflect true fair value | Anchor to the last candle of the rotation |
Trading during sideways rotation | VWAP pullback setups do not work well here | Wait for a clear trend before entering |
Ignoring session volatility | Slow reactions may look like failed setups | Be patient during low liquidity sessions |
Forcing trades without volume confirmation | Weak setups without institutional support | Only trade zones with clearly heavy volume |
Expecting perfect precision on anchor point | Overthinking slows down decision making | Accept that nearby candles work almost as well |
Avoiding these mistakes will help you apply the strategy with more confidence and consistency over time.
Conclusion
The Volume Profile pullback strategy gives traders a clear and logical way to find high quality trade setups. By combining Volume Profile with Anchored VWAP, you can see exactly where big trading institutions were active and use that information to guide your own entries. This removes much of the guesswork that often leads new traders astray.
To summarize the process, start by scanning for a rotation with heavy volume, followed by a strong trend. Anchor your VWAP to the last candle of that rotation, since this candle usually marks where the trend truly began. Then wait patiently for price to pull back to that VWAP line before entering your trade. Remember that this method works best during trending conditions, not during sideways rotation, and that support and resistance can flip once price breaks through the VWAP.
The examples in this article show that this strategy can offer multiple opportunities within a single trend, as long as you remain patient and disciplined. Low volatility sessions may slow down price reactions, but the setup itself remains valid. With practice, you will start recognizing these zones naturally on any chart you study.
If you want to explore this strategy further, along with other Volume Profile and Order Flow methods, you can find detailed training resources built around these exact concepts.
Frequently Asked Questions
What is Anchored VWAP used for in this strategy?
Anchored VWAP marks the fair price from an important zone where big trading institutions were active. Traders use it to find pullback entries once price returns to that fair value.
Why should the VWAP be anchored to the last candle of a rotation?
This candle usually marks the true start of the trend, since it represents the moment institutions finished building their positions and began pushing price in one direction.
Does the Volume Profile pullback strategy work in all market sessions?
Yes, but reactions can be slower during low liquidity sessions, such as the Asian session. Traders should remain patient and allow extra time for the setup to develop.
Next steps:
Ready to put the Volume Profile pullback strategy into practice? Head over to trader-dale.com and check out the trading education packs and custom indicators built specifically for Volume Profile and Order Flow trading.

Really liked the way this explains the Volume Profile Pullback Strategy. The part about waiting for price to pull back into a key volume area makes a lot of sense, especially compared with chasing a move after a breakout. I also like the focus on confirmation rather than entering just because price reaches a level. Simple and practical explanation overall.