

Not every trading level is worth your money. Some levels hold. Others break right away. The difference often comes down to one idea, confluence. In this guide, you will learn volume profile confluence trading. It is a simple method that combines Volume Profile with two other tools, Fair Value Gaps and the Support/Resistance Flip. I draw on years of chart based trading experience to break this down step by step, using plain words and real chart examples. You will see how a Volume Profile signal, a Fair Value Gap, and a Support/Resistance Flip can line up on one price, and why that agreement matters.
Most traders only ever check one signal before entering a trade, then wonder why the level fails on them. Confluence fixes that gap in your process, and it does so without needing any extra indicators or paid tools. By the end, you will know how to spot a genuinely strong level and filter out weak ones before you risk real money. You will also have a simple checklist you can run through on any chart, in any market, before your very next trade. This is the same checklist I use on my own charts every day, and it takes only a few extra seconds to run.
Table of Contents
5 Quick Points
- Confluence means two or more independent setups point to the same price level.
- Volume Profile shows where heavy trading activity happened. Your starting anchor.
- Fair Value Gaps show aggressive buying or selling, confirming the level via Smart Money Concepts.
- Support/Resistance Flip shows an old level switching roles, confirming the level via price action.
- All three agreeing makes the level far stronger than any single setup alone.
What Confluence Means in Trading
Why Confluence Matters in Volume Profile Confluence Trading
Confluence in trading happens when two or more independent tools point to the exact same price level. Think of it like getting a second and third opinion. One opinion might be wrong. Three opinions that all agree are much harder to ignore.
In volume profile confluence trading, you never rely on one tool alone. You stack evidence instead. A Volume Profile setup by itself can flag a decent level. But price does not always respect it. Sometimes the level fails and price cuts straight through. Confluence becomes your filter here. A second tool, like a Fair Value Gap, can confirm that spot. A third tool, like a Support/Resistance Flip, can confirm it again. When they agree, your confidence in the level should rise.
The Confluence Tools and the One Rule to Follow
Several tools work well as confluence partners. Fair Value Gaps come from Smart Money Concepts. Support/Resistance Flip is an old school Price Action setup. The Yearly Point of Control and VWAP with its deviations are two more options worth exploring later. This guide focuses on the first two tools. They pair naturally with Volume Profile.
One rule is worth repeating. Rarely take a trade without at least one extra confluence. This habit saves you from many low quality trades. It forces you to pause before every entry. Ask yourself a simple question. Does anything else agree with this level? If not, it may be smarter to wait. If two other tools agree, the setup deserves real attention.
This approach also builds patience. Not every day offers a clean, three way confluence. Some days show just one or two signals. That is fine. The goal is never to force trades. The goal is to raise your quality bar. Confluence cannot guarantee a winning trade. Nothing can promise that. But it stacks the odds in a smarter, more disciplined way.
Volume Profile Confluence Trading: The Base Setup
What a Volume Profile Shows You
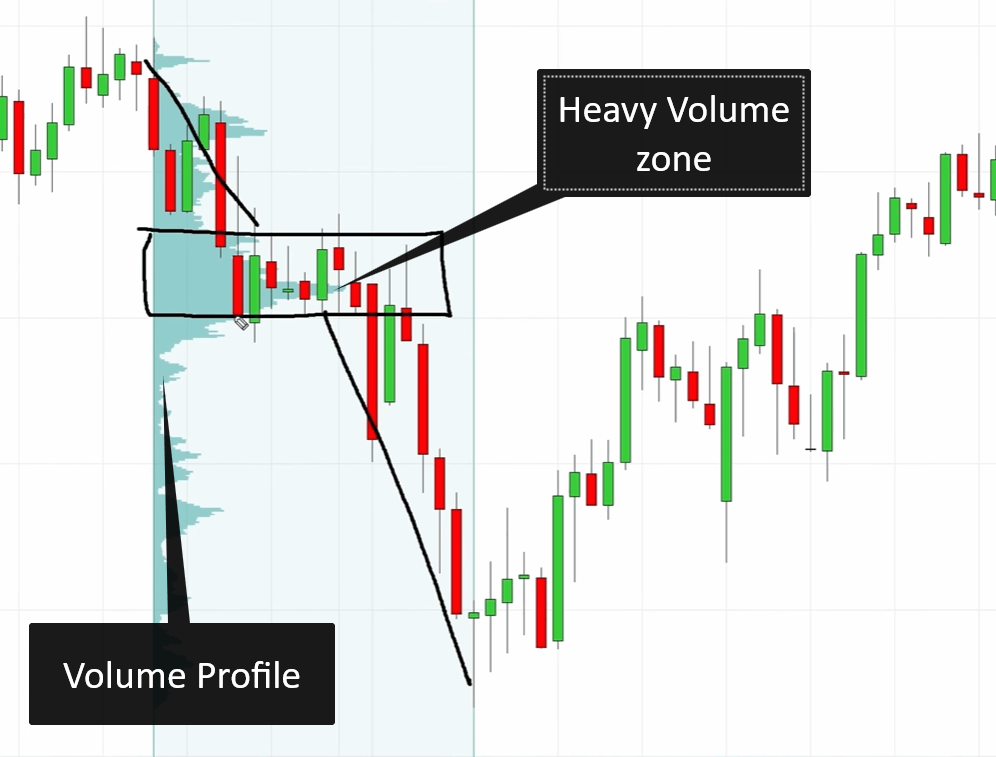
Before adding confluence, you need a solid starting point. That point is the Volume Profile. It shows how much trading volume happened at each price level over a chosen period. A normal chart only shows price on a vertical axis. A Volume Profile adds a horizontal histogram beside the price, and taller bars mark prices where a lot of buying and selling took place.
Why does this matter? Heavy volume at a price tells you that many traders agreed price was fair there, or that a big move began from that spot. In a trend, you often spot a significant volume cluster, a thick zone on the profile where activity spiked. This cluster often marks the start of a strong directional move, up or down.
The Step-by-Step Volume Profile Trading Process
Here is the basic process. First, find the trend, direction does not matter for this method. Second, look inside that trend for a heavy volume cluster. Third, mark the very start of that cluster. Fourth, wait for price to pull back toward that zone. Fifth, once price returns, you have your Volume Profile trading level.
This method is already useful on its own, and many traders use Volume Profile alone. But volume profile confluence trading goes one step further, checking whether other independent tools agree with your level. This extra step separates a basic Volume Profile trader from someone using a complete confluence strategy.
Volume Accumulation: A Second Pattern to Watch
There is a second pattern worth knowing, called Volume Accumulation. This happens when price moves sideways for a while, building heavy volume in a tight range, almost like a rotation. When price finally breaks out and shoots away, one side clearly won the battle. A pullback toward that accumulation zone can also become a trading level, growing stronger once other tools confirm it.
Remember, the start of the volume cluster is your anchor. Everything else in this guide gets compared back to it. If a Fair Value Gap or a flip lines up closely, you have confluence. If they sit far apart, the setup is weaker.
Fair Value Gaps: Your First Confluence Tool
How to Identify a Bearish or Bullish Fair Value Gap
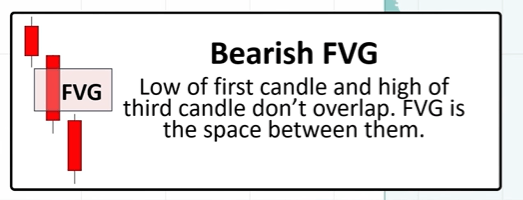
A Fair Value Gap, often shortened to FVG, comes from Smart Money Concepts. It forms from three candles in a row and shows a moment where price moved so fast it left a visible gap behind, a sign of real aggression from buyers or sellers.
Here is how to spot one. Look at three candles side by side, candle one, two, and three. In a bearish Fair Value Gap, compare the low of candle one with the high of candle three. If there is a gap between them, with no overlap, you have found a bearish gap. This signals aggressive selling and is often followed by more downside.
In a bullish Fair Value Gap, the comparison flips. Look at the high of candle one and the low of candle three. If a gap sits between those points, you have a bullish gap, showing aggressive buying.
Where to Trade a Fair Value Gap
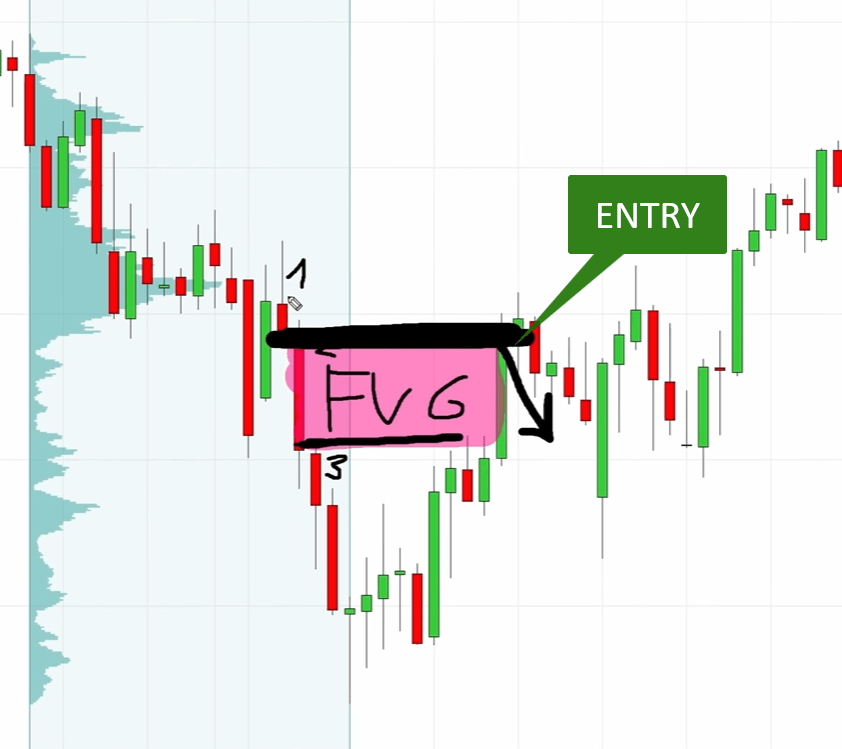
Once you find a gap, the rule is simple. Trade from the beginning of the Fair Value Gap, not the middle or end. For a bearish gap, that point sits at the top of the zone. For a bullish gap, it sits at the bottom, since this edge is where price is most likely to react.
Fair Value Gaps work well as confluence because they read the chart differently than Volume Profile. Volume Profile looks at how much trading happened at a price. Fair Value Gaps look at candle structure and speed instead.
Some traders only trade rejections that contain a Fair Value Gap. A sharp rejection plus a gap shows two signs of aggression stacked together, which can improve your win rate.
Support/Resistance Flip: A Simple Price Action Confluence
How a Support Level Flips Into Resistance (and Back)
The Support/Resistance Flip is one of the oldest ideas in price action trading. It still works well today. The concept is easy to picture. Say a price level acts as strong support, meaning price bounces off it more than once. That level gets remembered by the market. If price later breaks below it with force, the old support does not just disappear. It often becomes new resistance instead.
The same idea works in reverse. Say a level acted as strong resistance, meaning price got rejected there sharply. If price later breaks above that resistance, the old resistance can flip into new support. This is why the setup is called a flip. The role of the level switches from one side to the other.
Why does this happen? Think about the traders active at that old level. Some bought support hoping for a bounce and got stopped out when price broke lower. Others sold resistance and got stopped out when price broke higher. When price returns to that level, those traders react again, this time from the opposite side.
How to Spot and Trade a Support/Resistance Flip
Spotting a flip is straightforward once you know the steps. First, find a level with a strong, sharp reaction in the past. Second, confirm that price later broke through it with real conviction. Third, mark that old level. It has now flipped roles. If it was support, it is resistance now. If it was resistance, it is support now.
This tool pairs beautifully with volume profile confluence trading. It comes from pure price history, not volume data and not candle gaps. It is a third, independent way to confirm the same price. A volume cluster, a Fair Value Gap, and a flip together give you three unrelated pieces of evidence pointing the same way.
One practical tip. In live trading, these three levels rarely line up to the exact tick. Sometimes they sit a few pips apart. That is normal and still counts as valid confluence. The goal is not perfect alignment. The goal is general agreement between the zones.
Three Real Examples of Volume Profile Confluence Trading
Reading about a concept is one thing. Seeing it applied is what makes it click. Below are three chart examples showing volume profile confluence trading in action.
Example One: The Bearish Trend Confluence
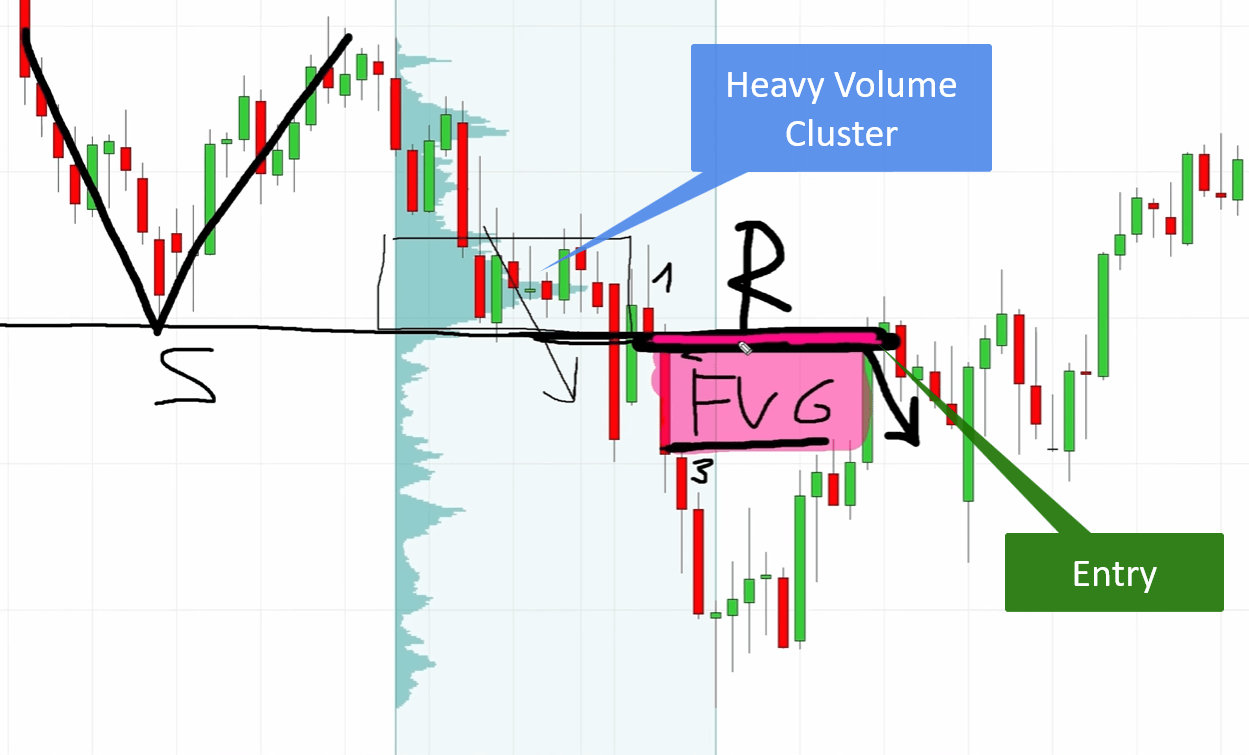
Price is in a clear downward trend. Inside it, a heavy volume cluster appears, the starting point for a Volume Profile trade. A bearish Fair Value Gap sits in almost the same spot, confirming aggressive selling right where the cluster begins. A Support/Resistance Flip is visible too, an old support level that has broken and become resistance. Three tools agree on one small zone, and the trade is a short entry, taken once price pulls back into it.
Example Two: The Bullish Trend Confluence
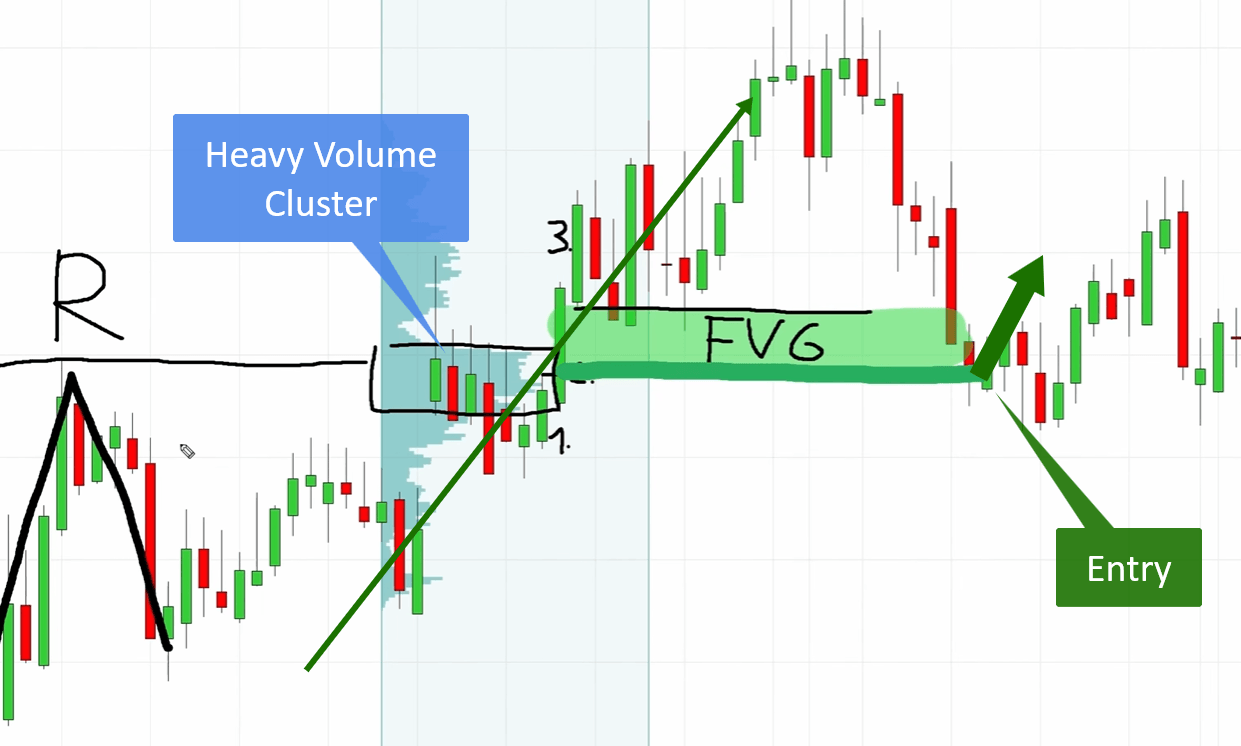
This example flips the direction. Price trends upward, with a significant volume cluster inside that trend. The Fair Value Gap here is bullish, confirming aggressive buying at the same spot. An old resistance level, rejected sharply in the past, has since flipped into support. The volume cluster begins slightly higher than the gap and the flip zone. When that happens, trade from the beginning of the Fair Value Gap instead, since it sits closer to the agreement.
Example Three: The Volume Accumulation Confluence
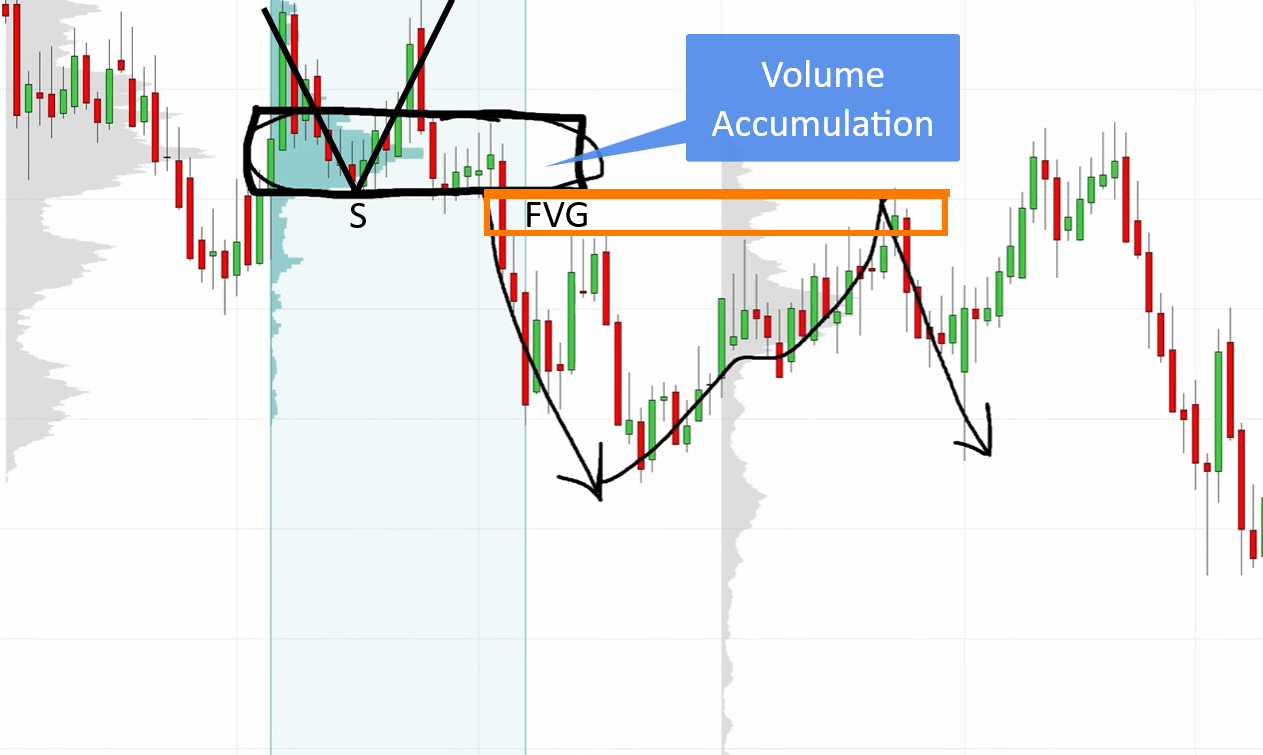
This example uses the Volume Accumulation pattern. Price rotates sideways, building heavy volume in a tight range, then breaks out downward with force, signalling active selling. A bearish Fair Value Gap sits right at the pullback zone. A Support/Resistance Flip confirms it too, since the level acted as support before price broke below it. Even a few pips apart, the picture stays a strong, tradable example of confluence.
Volume Profile Confluence Trading Cheat Sheet
A quick reference for your own charts:
Tool | What It Shows | Where To Trade From | Type of Evidence |
Volume Profile | Where heavy trading volume built up | Beginning of the volume cluster | Volume based |
Fair Value Gap | A fast move leaving a gap between candle one and candle three | Beginning of the gap zone | Candle structure based |
Support/Resistance Flip | An old level that has switched roles | The flipped level itself | Price history based |
Two tools lining up gives you a fair setup. All three lining up gives you a strong volume profile confluence trading setup worth watching closely.
Common Mistakes That Weaken Your Setup
Here are common mistakes traders make with volume profile confluence trading, and a fix for each one.
First, forcing confluence that is not really there, such as calling a gap valid when the candles actually overlap. Fix this by staying strict with your definitions.
Second, ignoring distance between the zones. A few pips apart is normal, but zones spread across a large range are coincidence, not confluence.
Third, skipping the trend or context check. Confluence works best supporting the bigger picture, such as an existing trend. Trading against strong opposing momentum is a common way to lose money.
Fourth, trading with zero confluence out of impatience. A single Volume Profile signal is often not enough on its own.
Fifth, over complicating the chart with too many tools. Two or three well chosen tools are usually enough to trade with real confidence.
Conclusion and Next Steps
Strong trading levels rarely rely on just one signal. Volume profile confluence trading works because it stacks independent evidence onto the same price. This means heavy volume, aggressive candle gaps, and flipped support or resistance. When these three tools agree, you are looking at a level many different traders would recognize as important. That kind of agreement is hard to fake in live markets.
Throughout this guide, the process broke down into simple steps. Find your Volume Profile anchor first. Check whether a Fair Value Gap sits near it. Check whether an old level has flipped roles at that same spot. When two or three of these line up, you have a setup worth watching closely. When nothing lines up, patience remains the smarter choice.
The best way to learn this is to practice it directly. Open your own charts. Instead of trading the first Volume Profile signal you see, pause and check for confluence. Mark the Fair Value Gaps. Mark the old support and resistance levels. Over time, spotting these combinations becomes second nature.
Frequently Asked Questions
What is confluence in Volume Profile trading?
Confluence in volume profile confluence trading means a Volume Profile signal gets confirmed by another independent tool, such as a Fair Value Gap or a Support/Resistance Flip at roughly the same price.
Do all three confluence tools need to line up perfectly?
No. The zones often sit a few pips apart in real trading. As long as they stay reasonably close, it still counts as valid confluence.
Which confluence tool should beginners learn first?
Start with Volume Profile for your base level, add the Fair Value Gap next, then move on to the Support/Resistance Flip once you know basic support and resistance.
Next steps:
If you found this breakdown useful, watch the full video walkthrough above. It shows these examples marked live on the chart. Browse the related articles to keep building your skills. Try applying this checklist to your next three setups before you trade.
Confluence is only half the story. Knowing where to place your stop, how big to size the trade, and when to walk away is what turns a good level into a good trade. That is exactly what I cover inside the detailed course content. Join and get the complete framework, not just one piece of it.
Apply the coupon code KEVIN10 at checkout for an extra 10% discount.