Most traders know what a trend looks like. Prices moving consistently in one direction, higher highs in an uptrend, lower lows in a downtrend. The challenge is not identifying the trend. The challenge is finding a safe, logical place to enter it without chasing price or guessing where the next reaction might come from.
This is where Volume Profile becomes one of the most useful tools a trader can have. Rather than relying on generic indicators or arbitrary support and resistance lines, Volume Profile shows you the actual data: which price zones attracted the most trading activity during the trend. Those zones are not random. They represent areas where large market participants, such as trading institutions and professional funds, chose to place a significant concentration of their orders.
Learning how to trade pullbacks using Volume Profile means you are no longer entering trades based on feel or pattern recognition alone. You are reading where real volume occurred, understanding the institutional logic behind those levels, and positioning yourself to benefit when those participants defend their zones. This article walks you through the complete Trend Setup, from identifying the right volume clusters to combining the approach with a proven price action rule that makes the setup even more reliable.
Table of Contents
5 KEY POINTS
- The Trend Setup uses Volume Profile to find where institutional buyers or sellers were most active during a trend.
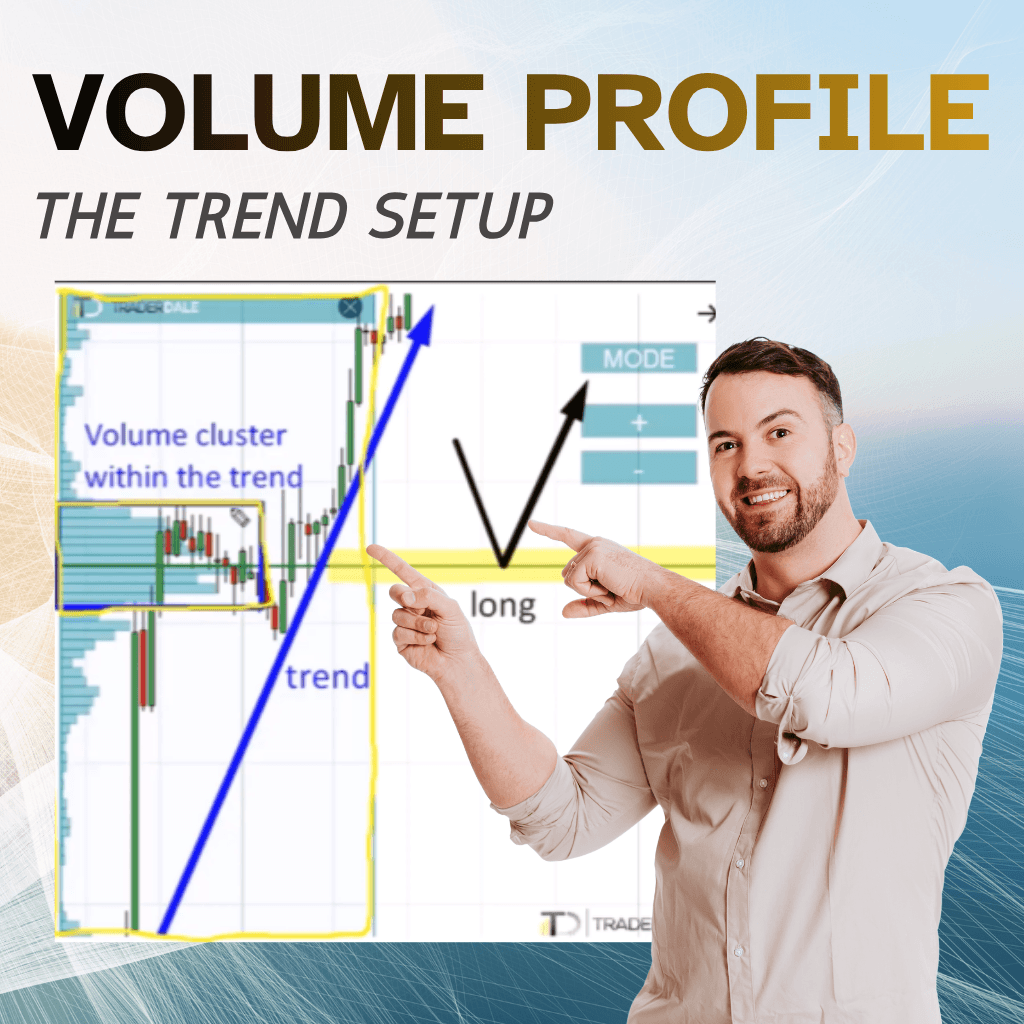
- You identify the heaviest volume cluster inside the trend, draw a line at its peak, and wait for price to pull back to that level.
- Each volume level should only be traded once. Skip any level that has already been tested and produced a reaction.
- When a volume cluster lines up with an old support-turned-resistance (or vice versa), the setup becomes significantly stronger.
- The core idea is the same across all Volume Profile setups: find the heavy volume area, wait for the pullback, then enter your trade.
1. What is the Trend Setup?
When a market is trending strongly, it creates a psychological pull. The price is moving, momentum is building, and the instinct is to get involved immediately. But entering a trade in the middle of a fast move means you are often buying at the top of a leg or selling at the bottom of one, putting yourself in a position where even a small retracement can stop you out before the trend resumes.
The smarter approach is to wait. Let the price complete its current leg, pull back, and return to a meaningful level before committing to a trade. The question is: which level do you wait for? That is exactly what the Trend Setup answers.
How the Trend Setup solves that problem
The Trend Setup is a trading approach that uses the flexible Volume Profile to locate the specific price zones inside a trend where the heaviest trading activity occurred. These are zones where large market participants, such as trading institutions and professional funds, placed a significant concentration of their orders while helping drive the trend forward.
Because those participants committed substantial capital at those price zones, they have a strong financial incentive to defend them if price returns. When price pulls back to their entry zone, they act again, buying in an uptrend or selling in a downtrend, to protect their existing positions. That defensive activity is what creates the reaction you are looking to trade from.
The name is straightforward because the method is straightforward. You use this setup when there is a trend. The whole strategy comes down to one core principle: how to trade pullbacks using Volume Profile by identifying where institutional volume was clustered and trading from that level once price revisits it. In this article, you will learn exactly how to identify those volume clusters, how to draw your trade levels, when to enter, and how to combine the setup with a classic price action rule that makes it even more reliable.

2. Why Volume Clusters Tell You Where Big Players Acted
What the Volume Profile is actually showing you
When you apply a flexible Volume Profile over a trending move, you are looking at how much trading volume occurred at each price level throughout that entire trend. In a healthy, moving trend, most price levels will show modest, consistent volume. But occasionally, you will see a bump on the profile, a level where volume is visibly higher than its neighbours. That bump is a volume cluster.
A volume cluster is not random noise. It marks a price area where large market participants chose to place a significant number of their orders. In an uptrend, this typically means institutional buyers were aggressively adding to their long positions while simultaneously helping push the price higher. In a downtrend, it means large sellers were building short positions as they drove the price down.
Think of it this way: these institutions committed a large portion of their capital at that specific price zone. Because of that commitment, they have a strong financial incentive to defend that zone if the price returns to it. They do not want the market to trade through the level where they entered, because that would put their positions underwater. So they buy again, or sell again, to protect their trade. That defensive activity is what creates the reaction you are positioning yourself to trade from.
How to recognise a significant cluster
Not every small bump on the Volume Profile qualifies as a tradeable cluster. You are looking for bumps that clearly stand out from the surrounding profile. With a little practice, this becomes intuitive. The cluster should be noticeably wider or taller than the average volume bars around it, making it easy to distinguish from the rest of the profile at a glance.
Clusters that barely differ from surrounding levels are less reliable. The more a cluster stands out, the more confident you can be that genuine institutional participation occurred there, and the more likely that zone is to hold when price revisits it. When in doubt, skip it. The best clusters are obvious. You should not have to convince yourself that a bump is significant. If it clearly stands out, it qualifies. If you are unsure, wait for a clearer setup on another instrument or timeframe.
3. How to Apply the Trend Setup Step by Step
The Trend Setup follows a clear, repeatable sequence. Once you understand each step, it becomes something you can apply consistently across different markets and timeframes without second-guessing yourself. The entire process from chart analysis to trade entry can be broken into six distinct actions.
The six-step sequence
- Confirm there is a strong trend. The setup only works in a clear trending environment. Look for a market making consistent higher highs and higher lows (uptrend) or consistent lower highs and lower lows (downtrend). Sideways or choppy markets are not suitable for this approach.
- Apply the flexible Volume Profile over the entire trend. Stretch the flexible Volume Profile from the beginning of the trend to its current end. This gives you an accurate picture of how volume was distributed throughout the entire trending move, not just a portion of it.
- Identify the heaviest volume cluster. Scan the profile and look for the bump that stands out most clearly. This is your target level. It represents the zone where institutional activity was most concentrated during the trend.
- Draw a horizontal line at the peak of the cluster. The peak, meaning the exact price point where volume was at its heaviest within the cluster, is where you place your level. This is the line price needs to return to before you consider entering a trade.
- Wait for the pullback. Do not act until price returns to your drawn level. Patience is critical here. The whole point is to avoid chasing the move and instead let the market come to you at a level backed by real volume data.
- Enter a trade in the direction of the trend. When price reaches your level, enter in the direction the trend is moving. In an uptrend, you go long. In a downtrend, you go short. You are aligning with the institutional participants who are defending that zone.
The logic behind the entry
It is worth pausing to understand why this entry makes sense, not just mechanically, but in terms of market structure. When institutional buyers build positions inside an uptrend at a specific price zone, they are not passive. They have an active interest in seeing the price move higher. If the price retraces back to their entry zone, they face a choice: let the price trade through and accept a loss on their position, or defend the zone by buying again and pushing the price back up.
Most large participants choose to defend. Their position size is significant enough that they have both the incentive and the capital to do so. That defending activity is the reaction you are entering on. You are not predicting what the market will do. You are reading where the evidence of past institutional activity exists and positioning yourself alongside the participants most likely to defend it.
The logic is simple: those big players defend their positions. When price returns to the zone where they entered, they push it back in the direction of the trend to protect their trade.
4. Real Market Examples: Downtrend and Uptrend
Example one: trading a downtrend
Consider a market in a clear downtrend. Aggressive sellers are pushing the price lower with consistent momentum. You apply the flexible Volume Profile across the entire downward move and scan for the most prominent volume cluster.
When you find a bump that clearly stands out from the rest of the profile, that is your level. You draw a horizontal line at the peak of that cluster and then wait. As the price continues down and eventually makes a short-term pullback upward, it will retrace toward that line. When it reaches that level, you enter a short trade, in line with the downward direction of the trend.
The reasoning is the same as always. The institutional sellers who placed their short orders in that volume cluster do not want price to trade back above it. When the market retraces up to their entry zone, they defend it by selling again, which sends the price back down. That is the reaction you are entering on, a disciplined short entry with a volume-backed reason for being there, rather than a guess based on where you think the price might fall.

Example two: trading an uptrend on CHF/JPY
In an uptrend scenario, such as the CHF/JPY example where the market was trending upward throughout an entire week, you can use either a flexible or fixed Volume Profile. When the market trends consistently over a fixed time period such as a full week, both profile types will capture the same underlying information because the price was moving directionally across the whole period.
In this case, you identify the significant volume cluster that formed during the upward move. You draw the level at its peak and wait. The price eventually pulls back to that zone and reacts, providing a clean long entry. Institutional buyers who built their positions in that cluster step in again to defend their trades when the price returns, pushing it higher once more.
It is also worth noting that in some charts, there will be more than one cluster visible. If one cluster has already been tested and produced a reaction, it is spent and should be skipped. The next fresh, untested cluster below it becomes your next potential entry if the price continues pulling back. This is covered in more detail in the next section.

5. How to Handle Multiple Volume Clusters in One Trend
Why multiple clusters appear
In many trending markets, you will find more than one significant volume cluster along the move. This is normal, and it is actually a sign of a healthy, sustained trend driven by ongoing institutional participation. As the trend develops over time, institutions do not necessarily place all of their orders at a single price zone. They may add to their positions at several different levels as the move progresses, creating multiple distinct clusters along the Volume Profile.
Each of those clusters represents a separate zone where defensive activity could occur if price returns. That gives you multiple potential entry levels on a single trending instrument, which is a useful thing to have, provided you manage them correctly.
The one-trade-per-level rule
Once a volume cluster level has been tested by price and has produced a reaction, that level is spent. You do not trade it again. The reason is that the institutional participants who were defending that zone have already reacted. Their defensive orders have been absorbed into the market. If the price comes back to the same level a second time, there is far less institutional support remaining to defend it, and the setup loses most of its edge.
When you have multiple clusters available in a single trend, the approach is straightforward. You identify all significant clusters from the Volume Profile. You skip any that have already been tested and produced a reaction. You focus your attention on the untested clusters, working through them sequentially as the price pulls back to each one. In an uptrend, you trade them from the highest untested cluster downward. In a downtrend, from the lowest untested cluster upward.
A practical example with multiple levels
Imagine an uptrend with three visible volume clusters. The first has already been tested, price pulled back to it and bounced. That one is spent. The second and third are untested. When price pulls back to the second cluster, you enter long. If the price continues pulling back further, you enter another long from the third cluster. Each entry is independent and each level is only used once.
This is an important discipline because skipping spent levels keeps you away from zones where the edge no longer exists. Trading only fresh, untested clusters gives you the highest probability setups the Trend Setup has to offer. It also prevents you from overtrading a single zone repeatedly and wondering why it stops working after the first reaction.
Cluster status | What it means | Should you trade it? |
Untested | Price has not yet returned to this zone after it formed | Yes — this is your primary target |
Tested once | Price pulled back, produced a reaction, and moved away | No — the level is spent |
Tested multiple times | Price has revisited the zone more than once | No — institutional support is likely exhausted |
6. The Volume and Price Action Combo Setup

What the combo adds to the Trend Setup
The Trend Setup is already a structured, logical approach to finding entries. But when you add a second layer of confirmation from price action structure, the setup becomes noticeably more reliable. The second layer comes from a classic price action concept that has been used by traders for a long time: support becoming resistance, and resistance becoming support.
Here is the principle. In the past, a price zone acted as a strong resistance. The market repeatedly struggled to push through that level, and each attempt created a visible, sharp rejection. At some point, the price broke through that resistance, and the zone flipped. What was previously a ceiling for price became a floor. That flipped zone is now a support. In a downtrend, the reverse applies: a zone that previously held as support gets broken and becomes a new resistance.
On its own, this price action concept provides a reasonable basis for a trade. But when that flipped level aligns exactly with a volume cluster from the Trend Setup, you have two independent pieces of evidence pointing to the same price zone. The Volume Profile tells you institutional participants placed heavy orders there. The price action tells you the market has historically recognised this zone as a significant boundary. When both signals agree on the same level, the confluence makes the zone far more significant than either signal on its own.
Why the combo improves your results
The reason the combo is more powerful is straightforward. Two separate market mechanisms are supporting the same price zone. Volume Profile identifies it through data: where real orders were placed. Price action identifies it through structure: where the market has historically respected the level as a boundary. When you see both lining up, you are not just finding a good level. You are finding a level that has been validated from two completely different analytical angles.
In practice, these setups tend to produce cleaner reactions with a higher win rate than either setup used alone. The price action component gives you the structural context. The Volume Profile component gives you the institutional backing. Together, they identify zones the market is most likely to treat as significant when price returns to them.
● Uptrend combo signal A volume cluster forms inside an uptrend at a level where price previously struggled as resistance. Price broke through that resistance, which flipped to support. When price pulls back to this zone, you have both a volume-based and a price action reason to go long from the same level. |
● Downtrend combo signal A volume cluster forms inside a downtrend at a level where price previously had strong support. Price broke through that support, which flipped to resistance. When price pulls back to this zone, you have both a volume-based and a price action reason to go short from the same level. |
7. Trend Setup vs Volume Accumulation Setup: A Quick Comparison
Understanding the difference
You may have noticed references to the Volume Accumulation Setup throughout this article. The two setups are closely related and often appear on the same chart at the same time. Understanding how they differ helps you categorise what you are seeing on a chart and apply the right label to the right level, even though the core trading action, finding a heavy volume zone and waiting for a pullback, is identical for both.
The Volume Accumulation Setup identifies heavy volume areas that form during price rotations or consolidation phases before a strong trend begins. Those are volumes built up as the market gathered energy before making a big directional move. The Trend Setup, on the other hand, identifies heavy volume clusters that form within the trend itself, as price is already moving directionally and institutions are adding to their positions along the way.
How both setups appear on the same chart

In practice, you will often see both types of levels on the same chart simultaneously. An instrument might have a Volume Accumulation level from the base of the move, where the big rotation happened before the trend started, and one or more Trend Setup levels from clusters that formed as the trend progressed above it.
Both are valid. Both are traded the same way. Both represent zones where institutional activity occurred and where defensive behaviour is likely when price returns. The label you attach to each level is less important than the core principle behind both of them: find the heavy volume, wait for the pullback, and enter your trade in the direction the market was moving when those volumes were placed.
Feature | Trend Setup | Volume Accumulation Setup |
Where volumes form | Inside the trend as price moves directionally | During a rotation or consolidation before the trend |
Profile type used | Flexible Volume Profile over the trend | Flexible Volume Profile over the rotation |
Trade direction | In the direction of the current trend | In the direction of the breakout from the rotation |
Entry trigger | Pullback to the heaviest volume peak in the trend | Pullback to the heaviest volume peak in the rotation |
Core principle | Institutions defend their trend positions | Institutions defend their accumulation positions |
Final Thoughts
The Trend Setup is one of the cleaner ways to participate in a trending market without chasing price or entering at random. By using the Volume Profile to locate where institutional participants placed their heaviest concentration of orders during the trend, you identify levels that have genuine structural significance, not arbitrary lines drawn on a chart.
The rules are consistent. You find a strong trend. You apply the flexible Volume Profile across it. You mark the most prominent volume cluster and draw a level at its peak. You wait for price to pull back to that level. You enter in the direction of the trend. You only trade each level once. And when you can combine that volume level with a flipped support or resistance zone from the past, you get an even higher-quality setup that carries two separate layers of market confirmation.
Patience is the skill behind the method
What makes this approach worth building into your routine is the clarity of the logic behind it. You are not guessing. You are reading where real volume occurred, understanding why those participants are likely to act again at that price, and positioning yourself to benefit from their defensive behaviour. That is a disciplined framework that rewards patience above everything else.
Patience is what separates structured trading from impulse-driven decisions. The Trend Setup gives you a clear reason to wait and a clear signal to act. When both appear together, the entry is not a guess. It is a calculated decision backed by the most transparent form of market data available: where volume actually traded.
Next Steps:
If you want to go deeper into Volume Profile trading strategies and how to apply them across different market conditions, visit trader-dale.com and explore the full trading course and tools available there.