Today, I would like to show you one of my favorite Price Action trading setups called AB=CD Setup.
You can use this setup both for intraday and for swing trading.
In this post, I will show you the AB=CD setup on a Daily chart, which I use for my swing trade analysis.
How does the strategy work?
The AB=CD setup is based on the market psychology and on the fact that the price does not usually move without corrections (pullbacks).
I think I best explain this with a picture.
*Example is on AUD/CAD; Daily chart:
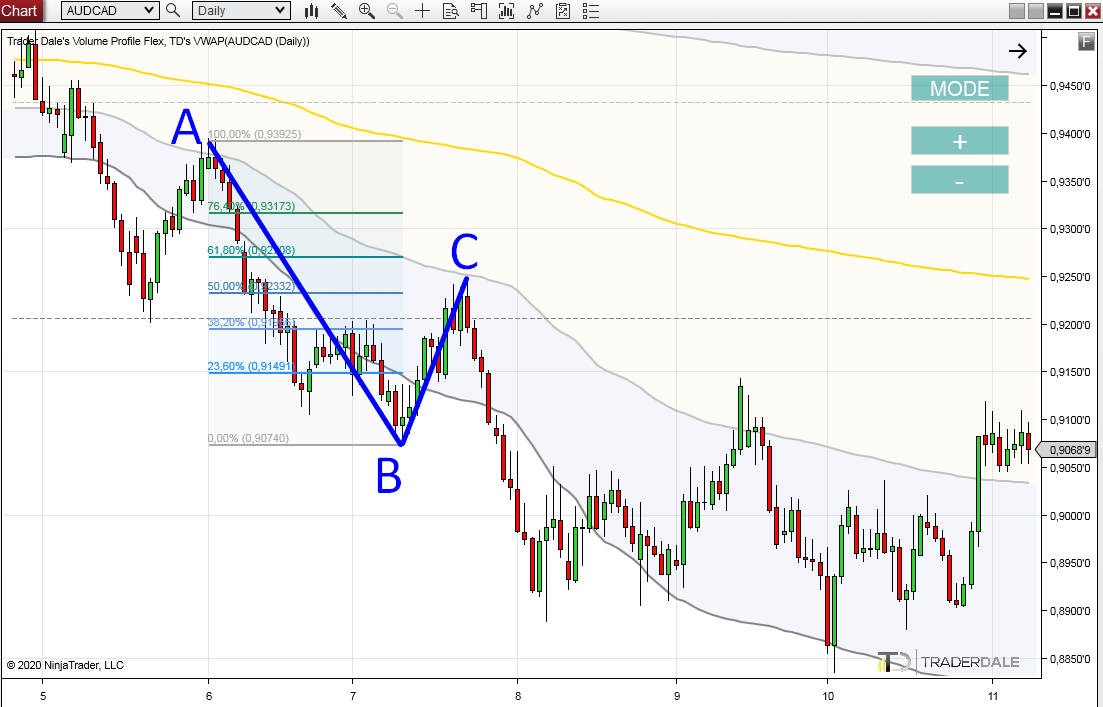
How to use it? Exact steps:
First you need to find significant swing points. I will call them A and B. Then you need to see a correction which goes at least to 50% of distance from A to B.
In this example, the distance from A to B is 319 pips. So, C must be a swing point, at least 160 above B.
You can use standard Fibonacci tool to measure the distances.
After identifying C, you need to look for D.
D is the same distance from C as A is from B. In this case 319 pips.
So, what you do is that you simply move the Fibonacci tool you already have in your chart so it begins in the point C.
Important thing is that you just move the fibo. DON’T CHANGE THE DISTANCE it measures (the 319 pip distance).
This will point you to the point D, which will mark your resistance.
Below is the same chart, with Fibonacci shifted so it shows C and D.
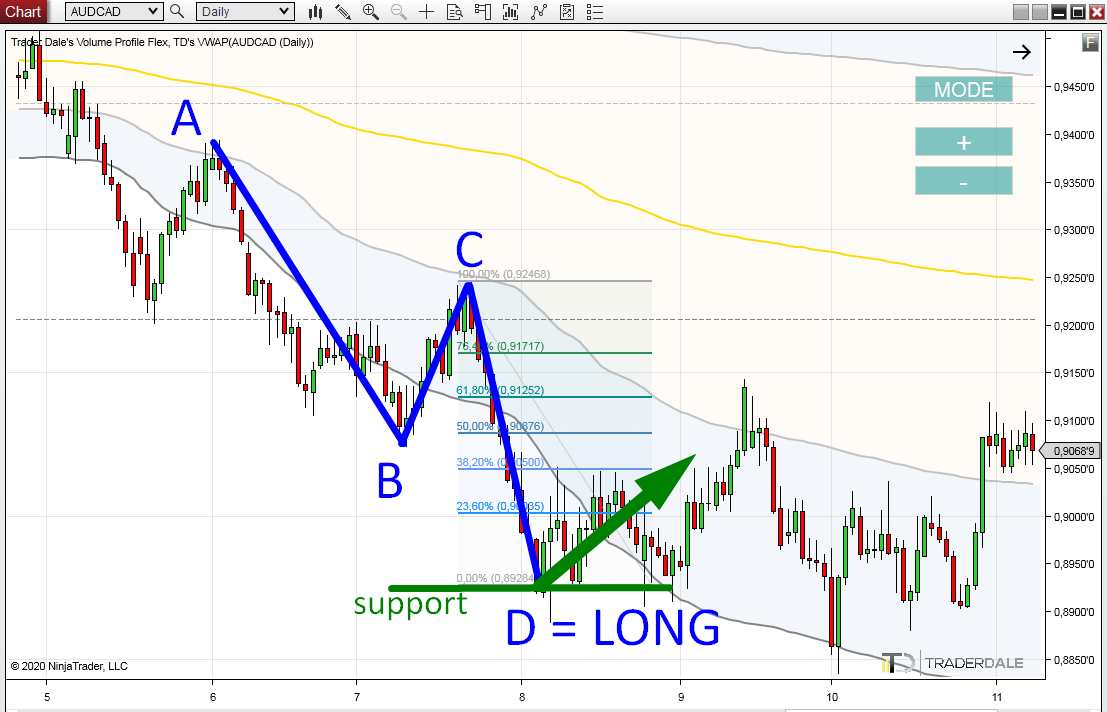
The reason this setup is called AB=CD is because the distance from A to B are the same as distance from C to D.
D marks the support you can go long from.
Do you want ME to help YOU with your trading?
Current situation on AUD/CAD
What you saw in the previous example was a scenario that already happened the last year.
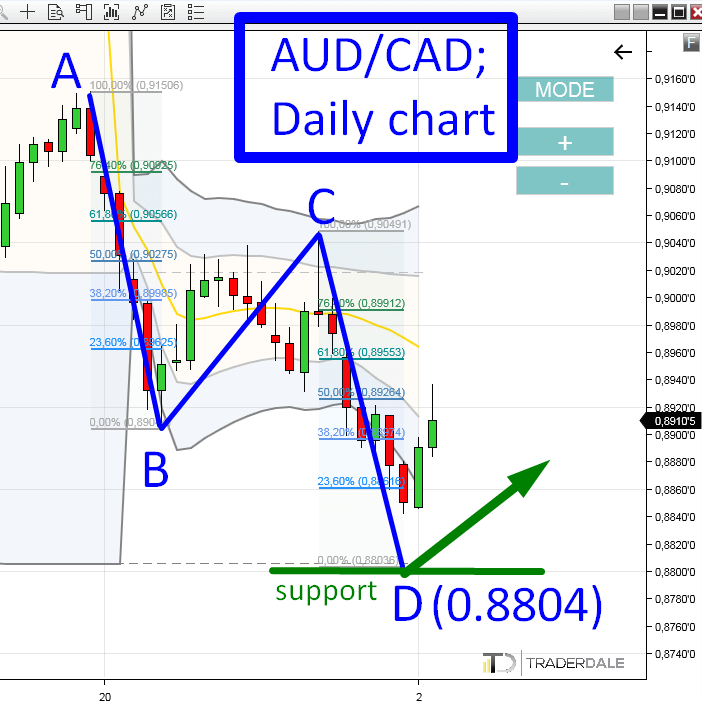
Lets now have a look at a current price development on the same trading instrument (AUD/CAD; Daily chart).
Currently, there is again the wave-like movement and thus we can use the AB=CD method.
This time I draw everything into one chart. Again, distance from AB=CD.
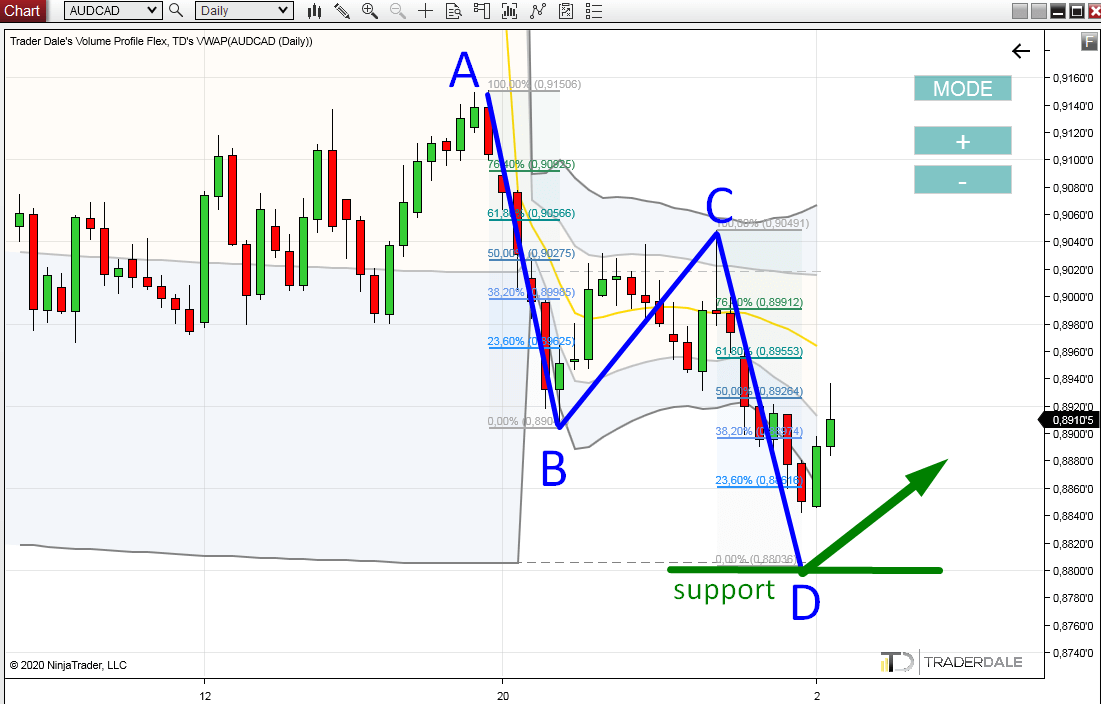
The point D marks a support (at 0.8804). When the price reaches it, there will be a high probability, that the price will turn there and go at least temporarily upwards.
Trading AB=CD as a standalone strategy
You can trade this setup as a standalone strategy but I personally prefer to have some more confluences with other strategies which would confirm the support/resistance levels this AB=CD method shows.
It would be best if there was some significant volume area created around the point D in the past.
In this case there is nothing like this because AUD/CAD is at it’s 10 year lows.
Still, the AB=CD setup on a Daily chart is a strong signal and I think we can expect a reaction there.
Recommended Forex Broker
Want to learn more about AB=CD setup?
You can learn more about this setup in the new Video Course which is included in the Learning Pack. You can get it here:
Happy trading!
-Dale