
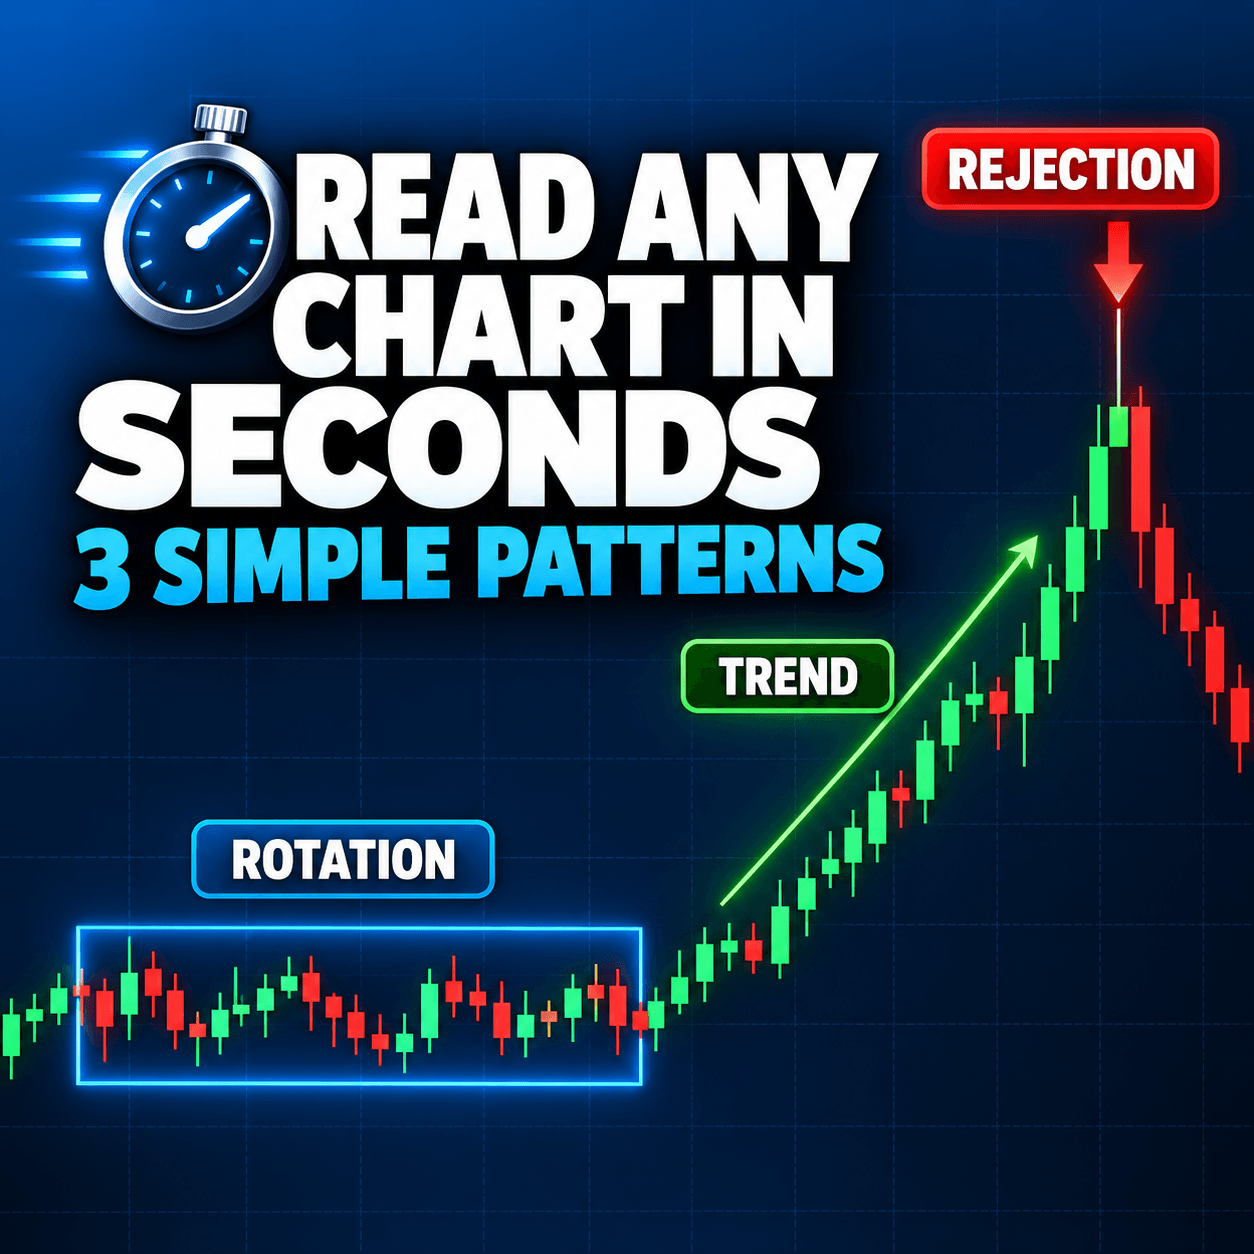
Do you open a chart and feel lost in a sea of candles? In this article, you will learn how to read trading charts quickly by spotting just three simple patterns. By the end, you will understand any chart in just a few seconds.
Here is the good news. Every chart you will ever see is made of only three things: a rotation, a trend, or a rejection. It does not matter if you trade Forex, futures, stocks, or Gold. It also does not matter if you use a 5 minute chart or a daily chart. These three patterns are always there, and nothing else.
I have traded with Volume Profile and Order Flow for many years. This simple way of looking at charts is one of the first skills I teach my students. It saves time, removes confusion, and gives you a clear starting point for every trading decision.
In this guide, I will show you what each pattern looks like and how often it appears. You will also learn what each pattern tells you about buyers and sellers. Then we will look at real examples on EUR/USD, the ES, and Gold. Finally, I will share practical ways to trade each pattern.
Open a chart, keep it next to this article, and let’s practice together.
Table of Contents
Summary of the Article in 5 Points
- Every chart is built from three patterns: rotation, trend, and rejection.
- Rotations appear about 70 to 80% of the time, trends about 20 to 30%, and rejections are rare.
- A rotation shows a fair price, a trend shows an aggressive side, and a rejection shows a defended level.
- The longer the rotation, the stronger the trend that usually follows.
- You can trade rotation edges, trend pullbacks, and rejection levels on any market and time frame.
What Are the 3 Patterns That Help You Read Trading Charts Quickly?
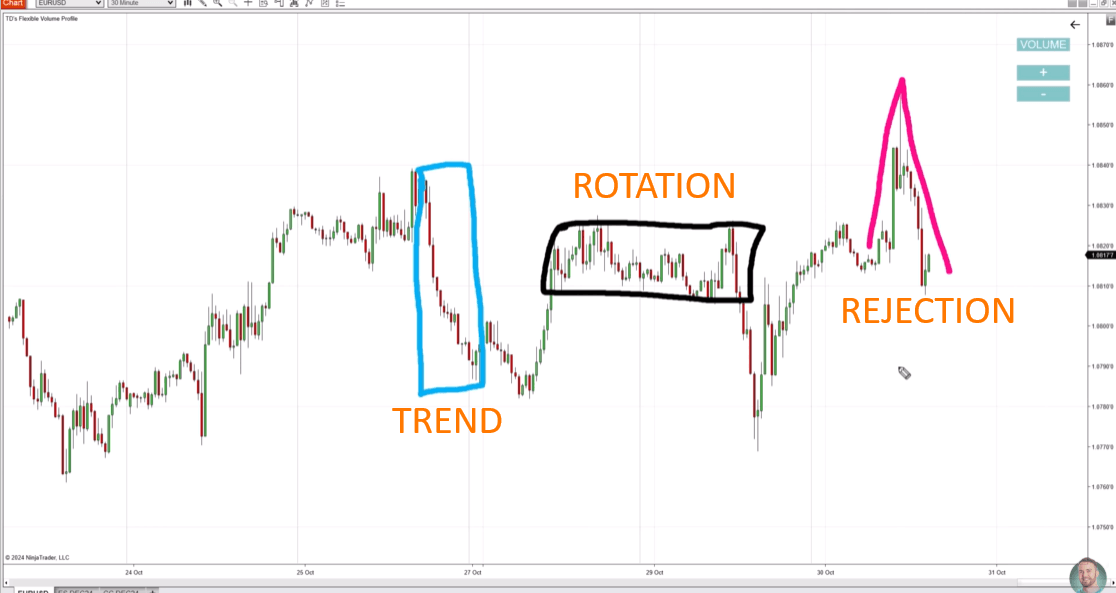
Before you can read trading charts quickly, you need a simple language for what you see. Most traders look at a chart and see hundreds of candles. Instead, I want you to see only three shapes.
The Three Chart Patterns in Every Market
Think of a chart like a sentence. A sentence is made of letters, and a chart is made of patterns. A chart has only three “letters” to learn.
- Rotation: Price moves sideways, up and down, inside a range.
- Trend: Price moves clearly in one direction, either up or down. Each swing pushes further than the last one.
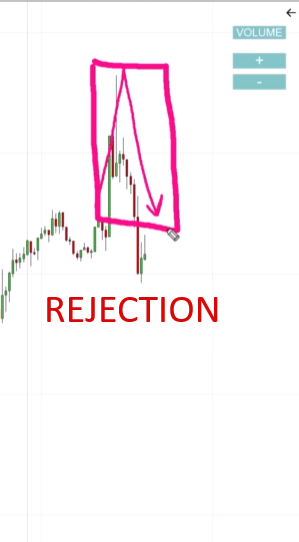
- Rejection: Price shoots toward a level and then quickly turns back. It leaves a sharp spike on the chart.
These three patterns exist on every chart, on every time frame, and in every market. That is what makes this skill so useful.
Pattern | What It Looks Like | What It Tells You |
Rotation | Sideways movement inside a range | Buyers and sellers agree on a fair price |
Trend | Strong move in one direction | One side is more aggressive |
Rejection | Sharp spike and a fast turn back | A price level was strongly defended |
How to Label Any Chart in Seconds
Open any chart and follow these steps.
- Step 1: Find the sharp spikes where price turned back fast. Mark each one with an arrow. These are your rejections.
- Step 2: Find the spots where price moved sideways. Draw a box around each one. These are your rotations.
- Step 3: Everything that remains is a move between areas. These are your trends.
I mark rejections first because they stand out. Then I highlight the rotations. Sometimes you will even find a small rotation inside a bigger trend. Whatever is left over is trend.
Every part of the chart now has a name. This is how you turn a messy chart into clear, easy patterns.
How Often Does Each Pattern Appear When You Read a Chart?
Now you know the three patterns. Next, let’s look at how often each one shows up. This matters a lot. When you know what is common and what is rare, you know what to expect most of the time.
Rotations: The Most Common Chart Pattern
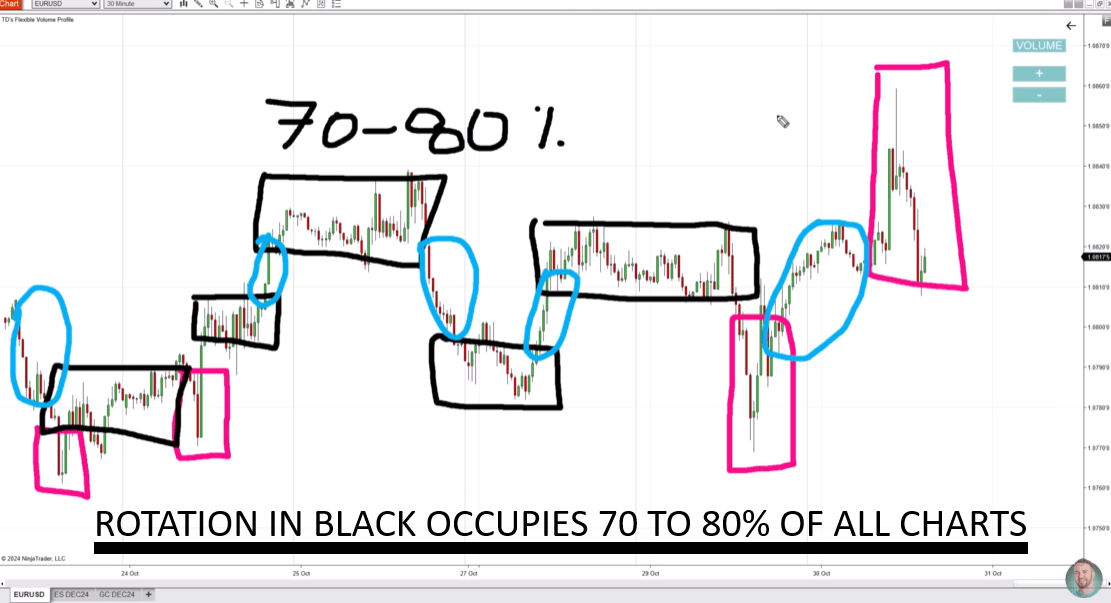
Rotations make up about 70 to 80% of the time on most charts. This is true across different time frames and different trading instruments. In simple words, the market spends most of its life moving sideways.
Many new traders do not expect this. They see big trends in trading videos and think markets always move fast. In reality, the market is usually quiet and balanced. Big moves are the exception, not the rule.
This is also a useful lesson for your mindset. If you keep hunting for big trends, you will often feel frustrated. If you accept that sideways movement is normal, you will stay calm and patient.
Trends and Rejections: Rarer Chart Patterns That Matter
Trends make up about 20 to 30% of the time. They are less common, but they are where price travels the farthest. A trend moves the market from one fair price area to a new one.
Rejections are rare. You will only see them from time to time. However, when they appear, they often mark very important price levels. That is why you should never ignore them.
Here is a simple table and chart to help you remember:
Pattern | How Often It Appears | Simple Meaning |
Rotation | About 70 to 80% | The market is resting |
Trend | About 20 to 30% | The market is moving |
Rejection | Rare | The market says “no” to a price |
Rotation ████████████████ 70 to 80% Trend ██████ 20 to 30% Rejection █ Rare |
Quick check: Look at your chart again. Does the sideways movement take up most of the space? In most cases, it will. |
What Does a Rotation Tell You About Buyers and Sellers?
Every pattern has a meaning. When you understand that meaning, you stop seeing random candles. You start seeing the story behind the price.
A Rotation Shows a Fair Price
When the price is in a rotation, the market is in equilibrium. This simply means buyers and sellers have found a fair price. Both sides are happy to trade here, at least for now.
Think of a busy fruit stall. If the price of apples is fair, people keep buying and the seller keeps selling. Nobody needs to change the price. That is exactly what a rotation looks like on a chart.
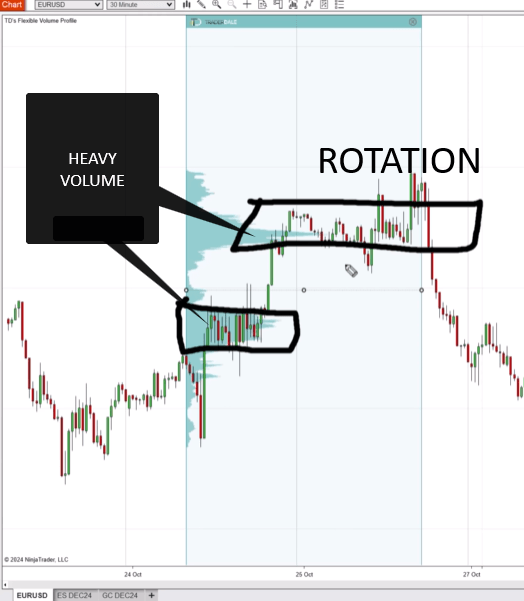
Rotations are also where heavy volumes are traded. You can see this with the Volume Profile. The wider parts of the profile show where the most volume was traded. These wide areas usually sit right inside rotations. If you want to learn more, read my article on Volume Profile shapes.
Big institutions often build their positions inside rotations. They trade huge amounts, so they need time and liquidity. A balanced rotation gives them both. It lets them buy or sell quietly without moving the price too much.
Why Longer Rotations Lead to Stronger Trends
Here is one of the most valuable insights in this whole article. The longer the rotation, the stronger and longer the trend that usually follows.
During a long rotation, institutions have more time to build big positions. When they are done, the price often breaks out with real power. All that stored energy gets released at once.
Imagine pulling back a rubber band. The longer you pull, the farther it flies when you let go. A long rotation works in a similar way.
So when you spot a long rotation on your chart, stay alert. A strong move may be coming soon.
What Do Trends and Rejections Reveal When You Read Trading Charts Quickly?
Rotations show balance. Trends and rejections show the opposite. They tell you when one side of the market has taken control, even for a short time.
Trends Show Which Side Is More Aggressive
Trends do not happen as often as rotations. But when they do, they send a clear message. One side of the market is much more aggressive than the other.
In a downtrend, sellers are more aggressive than buyers. They use market sell orders to push the price lower and lower. Buyers are there, but they are not strong enough to stop the move.
In an uptrend, the opposite is true. Buyers use market buy orders and keep lifting the price higher. Sellers step aside or get pushed out. A trend often starts right after a long rotation ends.
Here is a simple way to remember this: rotation means agreement, and trend means pressure. When you see a trend, ask yourself one question. Who is pushing the price right now, buyers or sellers?
Rejections Mark Important Price Levels
A rejection is a fast turn away from a price. Let’s look at a rejection of higher prices. First, buyers push the price up aggressively. Then sellers jump in and push it straight back down.
This tells you something big. Sellers defended that level with force. They did not want the price to go higher. Because of this, that area can become a resistance zone in the future.
The same idea works in reverse. A rejection of lower prices shows buyers defending a level. That area can become a support zone later. These defended levels often attract price again.
Rejections are rare, so mark them on your chart every time you see one. For a deeper look, read my article on strong and weak rejections.
Can You Read Trading Charts Quickly on Any Time Frame and Market?
Yes, you can. This method works on any time frame and any trading instrument. However, some charts are easier to read than others. Let’s look at three real examples.
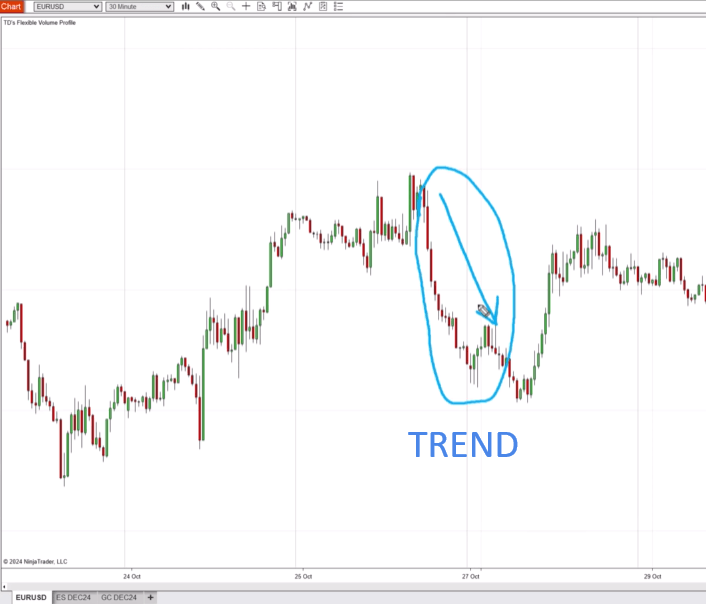
Example 1: EUR/USD 30 Minute Chart
On this Forex chart, you can read the patterns in two ways. You can see the big picture as one large trend. Or you can break it down into smaller rotations and trends inside that bigger move.
Both ways are correct. It simply depends on how much detail you want. A swing trader may only need the big picture. A day trader will get more from the smaller patterns.
Example 2: ES 5 Minute Chart
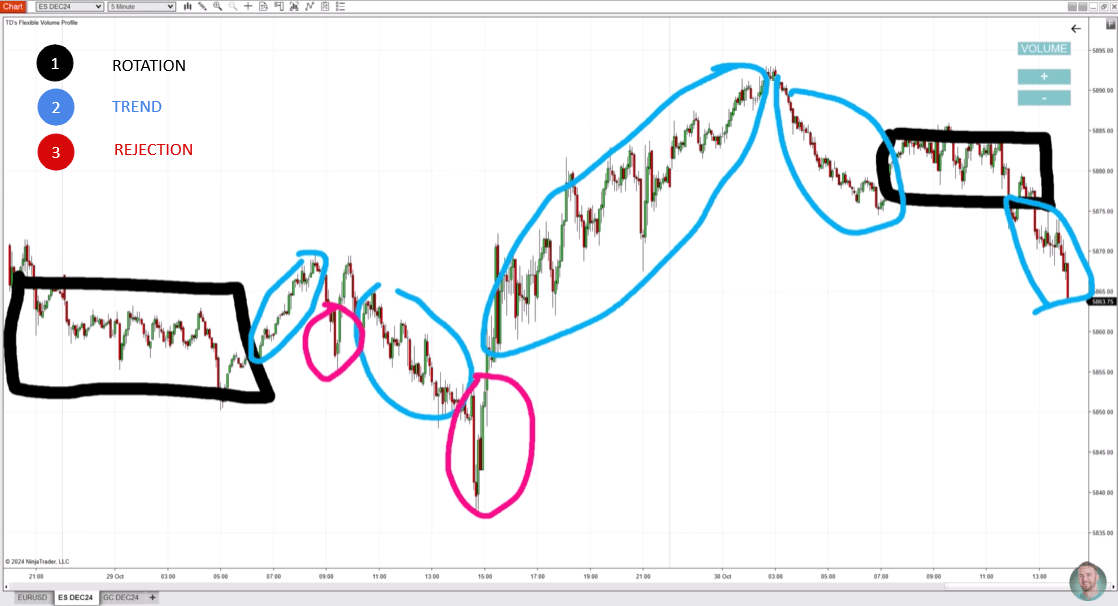
The ES is the futures contract on the S&P 500 index. On a fast time frame like 5 minutes, the market changes direction more often. This makes the patterns a little harder to spot.
Still, the structure becomes clear once you look closely. In this example, we see a rotation, then a big rotation. The rest of the chart is made of trends and rejections.
Example 3: Gold Daily Chart
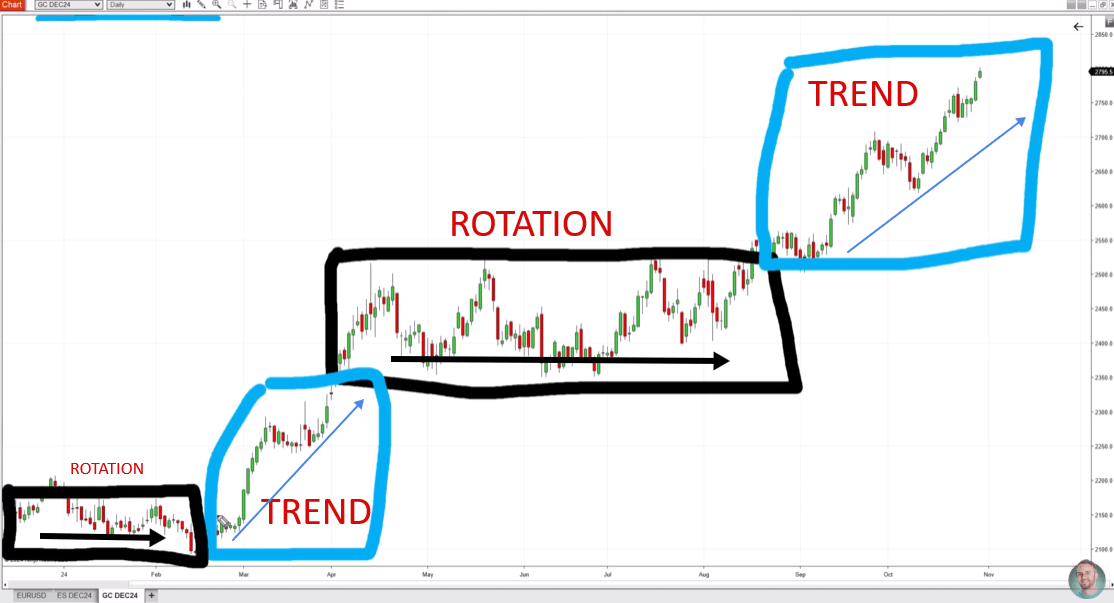
Higher time frames are usually calmer. There is less noise, so patterns are easier to recognize. On this Gold daily chart, we see a long rotation followed by a trend. Before that trend, there is another rotation.
Here is a quick summary of all three examples:
Chart | Time Frame | How Easy to Read | What We See |
EUR/USD | 30 minutes | Medium | One big trend, or smaller rotations and trends |
ES | 5 minutes | Harder | Rotations, a big rotation, trends, and rejections |
Gold | Daily | Easier | A long rotation, then a trend |
Tip: If you are new to this, start practicing on higher time frames. Move to faster charts once your eyes are trained. |
How Can You Use These Chart Patterns in Your Trading?
Spotting the patterns is the first step. The next step is using them. You can build your whole trading strategy around these three patterns.
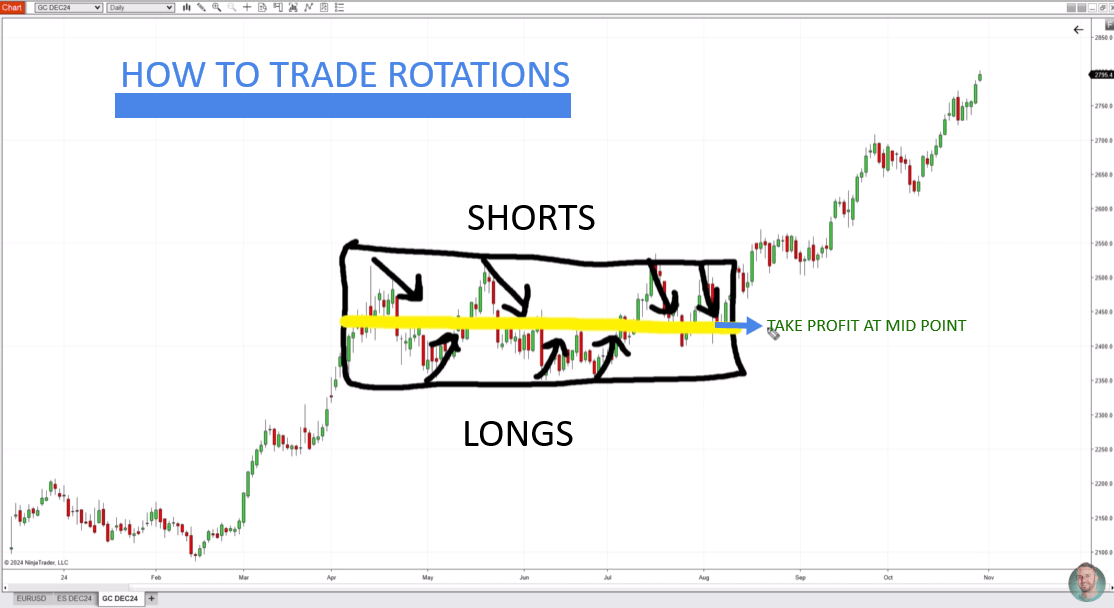
How to Trade a Rotation
In a rotation, you can trade from the edges toward the center. This means:
- Go short near the upper boundary of the rotation.
- Go long near the lower boundary of the rotation.
- Aim for the center of the rotation as your target.
After a rotation, a trend is likely to follow. The longer the rotation lasts, the more alert you should be, because a breakout could come at any time.
How to Trade a Trend
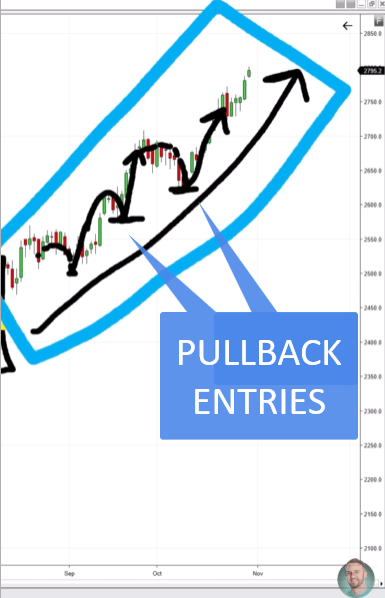
When the market trends, you have two main choices. You can use a breakout strategy, or you can join the trend on a pullback.
I prefer the pullback approach. In an uptrend, I wait for the price to dip a little. That dip is my long entry. When the next pullback comes, I can look for another entry. I like to wait for the market to give me a “discount” before I join the trend. You can see a full example in my Volume Profile pullback strategy article.
How to Trade a Rejection
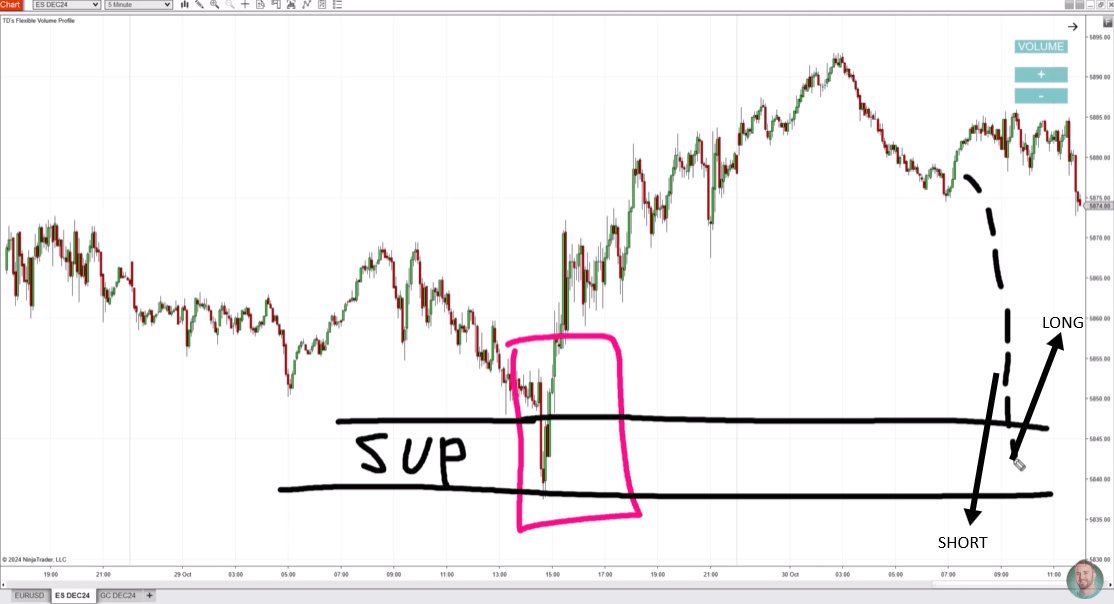
On the ES, for example, a strong rejection of lower prices shows a defended support zone. When the price comes back to that support, two things can happen:
- It bounces. This can give you a long entry.
- It breaks through. This shows that sellers are strong enough to beat the support. You might then think about going short.
Pattern | Strategy | Entry Idea | Watch Out For |
Rotation | Trade edges to center | Short at the top, long at the bottom | A breakout after a long rotation |
Trend | Join on pullbacks | Buy dips in an uptrend | Chasing price far from a pullback |
Rejection | Trade the defended level | Long on a bounce, short on a break | A weak reaction at the level |
Frequently Asked Questions About Reading Trading Charts Quickly
How long does it take to learn to read trading charts quickly?
It depends on how much you practice. At first, labeling one chart may take several minutes. That is completely normal. Be patient with yourself during this stage. After a few weeks of daily practice, most traders can spot the three patterns in a few seconds. The key is repetition. Open a few charts every day and label every rotation, trend, and rejection. Start on higher time frames, because they are calmer and easier to read. Move to faster charts only when you feel confident. Over time, your eyes will do the work almost on their own.
Which of the three chart patterns is the most important?
All three matter, but each one plays a different role. Rotations are the most common, so you will deal with them most of the time. Trends are where the biggest price moves happen. Rejections are rare, but they often mark key support and resistance levels. So instead of picking one favorite, learn what each pattern tells you. Knowing all three gives you a complete view. Then match your strategy to the pattern the market is showing right now. This simple habit keeps you from using the wrong strategy at the wrong time.
Do I need Volume Profile to use this method?
No, you do not. You can spot rotations, trends, and rejections on a plain price chart. However, Volume Profile makes this method even stronger. It shows you where heavy volume was traded, and that usually happens inside rotations. It can also help you find the exact levels that big institutions care about. The idea behind it comes from the Market Profile concept. If you already use Volume Profile, combine it with these three patterns for a clearer view of the market.
Conclusion: Start Reading Trading Charts Quickly Today
Reading a chart does not have to be hard. Every chart is made of just three patterns: rotation, trend, and rejection. Once you learn to spot them, you can read trading charts quickly on any market and any time frame.
Let’s recap the key lessons. Rotations show a fair price and appear most of the time. Trends show that one side is more aggressive. Rejections are rare, but they mark levels that were defended with force. And remember, the longer the rotation, the stronger the trend that often follows.
You can also turn these patterns into trading ideas. Trade rotations from the edges toward the center. Join trends on pullbacks. Watch rejection levels for a bounce or a break.
At first, this will take time and practice. Keep labeling charts every day, and the patterns will soon jump out at you.
What to do next: Want to learn my exact trading methods and strategies? Visit my website and open the “Trading Course and Tools“ section. There you will find my trading education and custom tools. Would you like to trade next to me and other experienced traders every day? Check out the Funded Trader Academy page and its live trading room. A short video there explains everything. |
Happy trading!
