
If you trade with Order Flow, you already know that not every level on your chart deserves your attention. High-volume node pullback trading is one of the simplest and most reliable ways to filter out the noise and focus only on the zones that matter. A high-volume node is the price level inside a footprint chart where the heaviest volume traded.
On its own, one high-volume node is useful. But when two or three high-volume nodes form right next to each other, they create a much stronger zone, and that zone becomes an excellent place to look for a pullback trade. In this article, you will learn what a high-volume node actually is, why clusters of them are so powerful, and how to trade a pullback into that zone step by step.
You will also see real chart examples so the idea becomes crystal clear. One of the best parts of this strategy is that it works on forex too, since you do not need bid and ask data to use it. By the end of this guide, you will know exactly how to spot these zones and how to plan a trade around them with confidence.
Table of Contents
5 Key Points
- A high-volume node is the single price level inside a footprint with the heaviest traded volume.
- When two or more high-volume nodes sit next to each other, they form a stronger zone that many Order Flow platforms highlight in yellow.
- High-volume node pullback trading means waiting for price to return to that zone before entering in the direction of the trend.
- Three high-volume nodes stacked together are even more powerful than two, and they often lead to a strong reaction.
- This strategy works well on the 30 minute time frame, and it also works on forex because it does not require bid and ask data.
What Is a High-Volume Node in Order Flow?
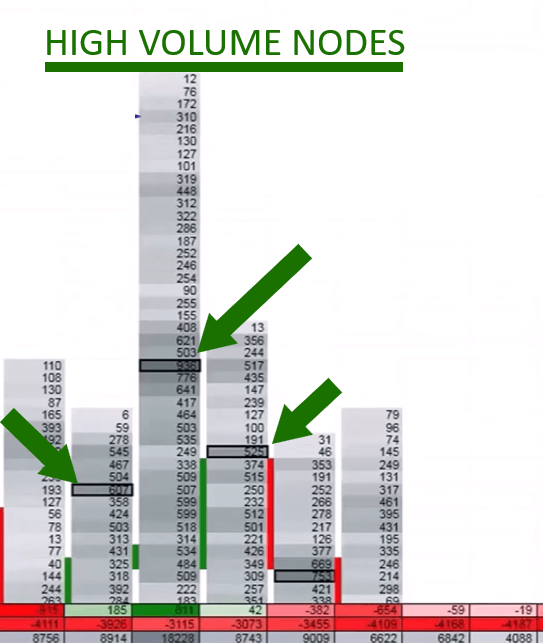
A high-volume node is the price level within a single footprint that traded the most volume out of every price level in that footprint. Order Flow software usually marks this level in brackets, which makes it easy to spot at a glance. Every footprint on your chart will have its own high-volume node, and that node represents the price where the largest battle between buyers and sellers took place during that period.
Why This Level Matters So Much
Think of a high-volume node as the price where the most trading activity happened, almost like the busiest checkout line in a store. That level tends to attract attention again in the future because so much business already took place there. This is exactly why trading high-volume node levels can give you an edge. The market has a kind of memory, and price levels where heavy volume traded once often become important again later.
On its own, a single high-volume node is a useful reference point, but it is not always strong enough to build a full trade around. That is why the next section focuses on what happens when two or more of these nodes line up right next to each other. When that happens, the strength of the zone increases significantly, and it becomes one of the clearest signals in high-volume node pullback trading.
Why Two or More High-Volume Nodes Matter More Than One
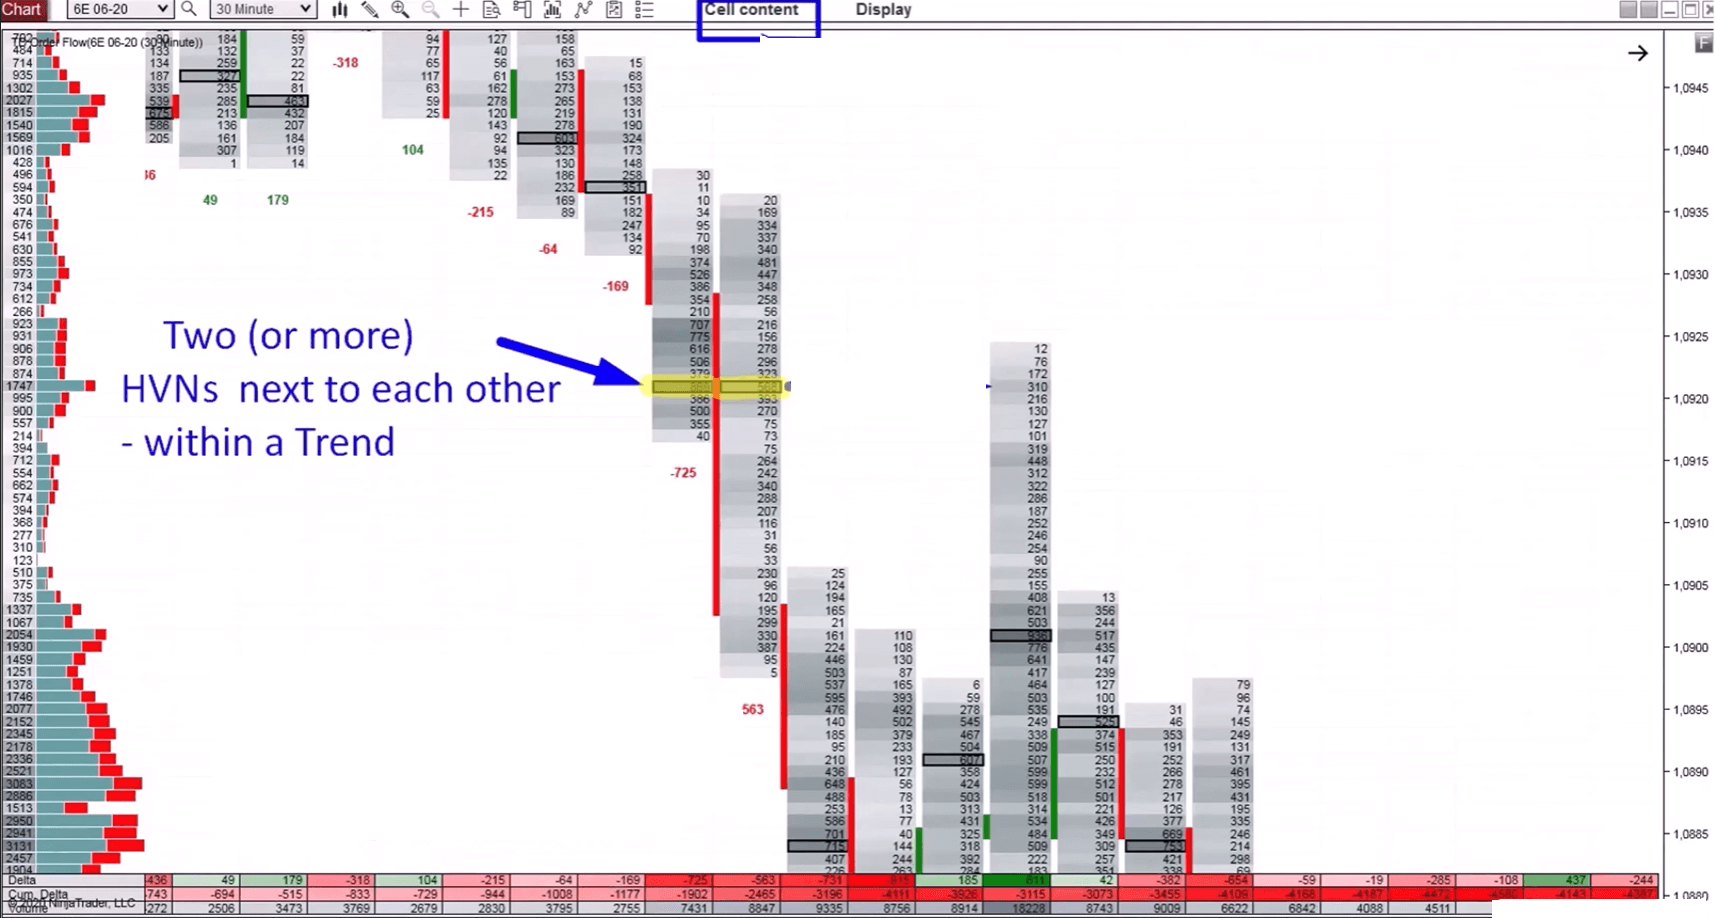
A single high-volume node tells you where heavy volume traded during one footprint. But when you see two high-volume nodes sitting directly next to each other, something more important is happening. This tells you that heavy volume traded at two adjacent price levels across two separate footprints, which means the market spent real time and real size defending that specific area.
Many Order Flow platforms will automatically highlight these clusters in yellow so you do not have to search for them manually. If your software does not highlight them, do not worry. You can still spot them yourself simply by scanning your footprint chart for two or more brackets that sit right beside each other in price.
What This Tells You About Institutions
What makes this zone so significant is what it tells you about institutional behavior. Double high-volume node zones suggest that large institutions were active at that price and that the level held real importance to them. Because institutions rarely trade small size and rarely walk away from levels they consider important, there is a strong chance they will defend that same zone again if price returns to it later.
This is where it gets even better. What is stronger than two high-volume nodes next to each other is three high-volume nodes lined up in a row. A triple high-volume node cluster is a rarer setup, but when it appears, it tends to produce a more powerful reaction because it shows sustained, heavy participation across three separate footprints rather than just two.
Whether you are looking at two nodes or three, the underlying logic behind high-volume node pullback trading stays the same. You are simply looking for proof that big players were active at a specific price, and you are planning your trade around the idea that they will likely return to defend it.
How to Trade High-Volume Node Pullbacks Step by Step
Trading this setup is very similar to trading a heavy-volume cluster, so if you already know that strategy, this one will feel familiar. Here is the process broken down into simple, repeatable steps.
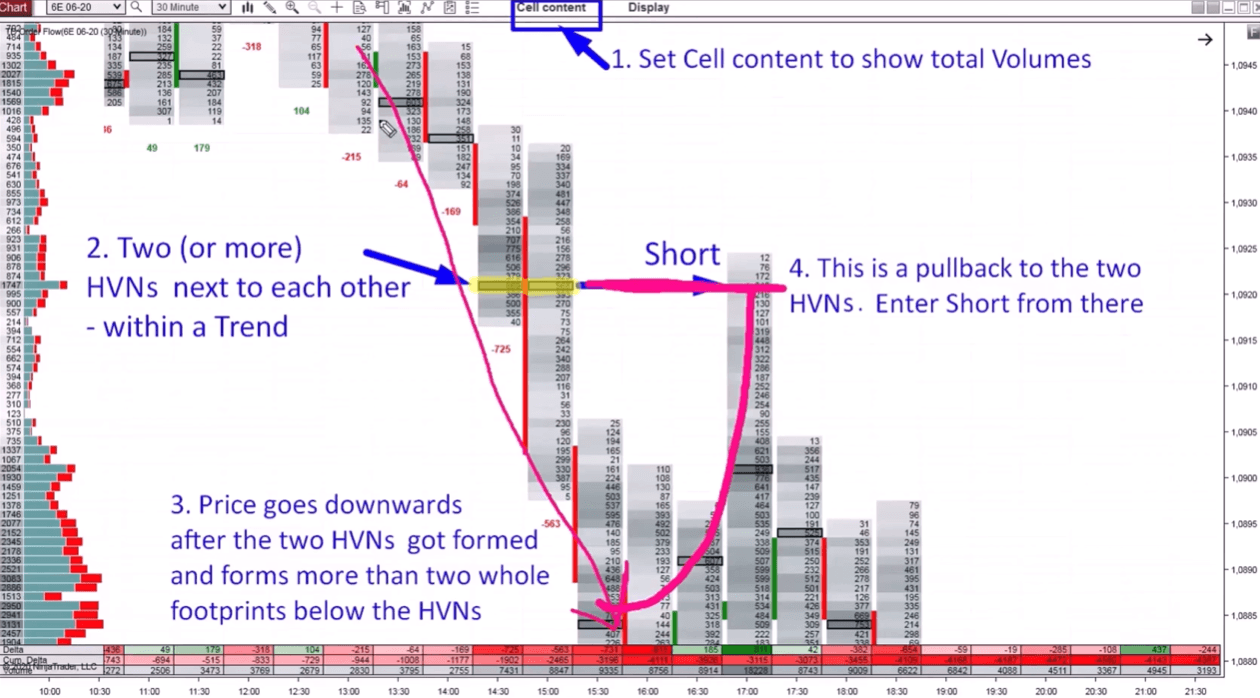
- Identify the trend. Look at the chart and determine whether the market is in a clear uptrend or downtrend. This strategy works best when there is a defined directional move already in place.
- Find two or more high-volume nodes next to each other. Scan the footprints within that trend for adjacent high-volume nodes, either highlighted automatically by your software or spotted manually.
- Mark the zone. Draw a horizontal zone across those high-volume nodes on your chart so it is easy to see when price approaches it again.
- Wait for the pullback. Do not chase price. Let the market pull back into your marked zone before you consider entering.
- Enter in the direction of the trend. If the trend was down, you look to go short when price returns to the zone. If the trend was up, you look to go long.
Trend Direction | Zone Type | Trade Direction |
Downtrend | Double or triple high-volume node | Go short on pullback |
Uptrend | Double or triple high-volume node | Go long on pullback |
The logic behind this approach is simple. High-volume node pullback trading works because it aligns your entry with both the existing trend and a price level where institutions already showed strong interest. You are not guessing where price might react. You are trading from a zone that already proved its importance once, and the odds favor it proving important again.
Real Chart Examples of High-Volume Node Pullback Trading
Seeing real examples makes this strategy much easier to understand, so let us walk through a few scenarios that show exactly how this plays out on a live chart.
Double High-Volume Node Examples
In one example, a downtrend was already in place when two high-volume nodes formed right next to each other. Price later pulled back into that exact zone, and the short trade worked out as the trend continued lower. In another example, there were actually two separate pairs of high-volume nodes close together. From that combined area, price continued dropping after the pullback, which reinforced just how strong that zone had become.
Triple High-Volume Node and Rejection Examples
A stronger example involved three high-volume nodes forming next to each other within a downtrend. This triple high-volume node setup led to a solid reaction once price pulled back into the zone, confirming that the more high-volume nodes you find stacked together, the more confidence you can have in the setup.
One more example involved a rejection of high prices where a double high-volume node formed within that rejection. Price moved away from the zone, returned later, and reacted exactly as expected. What made this example particularly interesting is that the double high-volume node also lined up with nearby heavy-volume clusters, and the two high-volume nodes themselves were only one tick apart. That kind of overlap between multiple types of zones tends to create even stronger support or resistance, which is a theme worth exploring further in the next section.
Best Time Frame for This Order Flow Strategy
Choosing the right time frame matters when you are trading high-volume node pullbacks, because the zones need enough time to form clearly without becoming too noisy to read. The 30 minute chart tends to work particularly well for this setup. It gives enough separation between footprints for high-volume nodes to stand out clearly, while still providing enough trading opportunities throughout the week.
That said, this is not the only time frame that works. The 5 minute chart and the hourly chart can also be used successfully, depending on your personal trading style and how much time you have available to watch the market.
One important guideline to keep in mind is that going above the hourly time frame is generally not recommended for this particular approach. As the time frame gets larger, footprints combine more volume from longer periods, which can blur the precision of individual high-volume nodes and make the zones less reliable. Staying at or below the hourly chart keeps your high-volume node pullback zones sharp and easier to trade with confidence.
Combining High-Volume Nodes With Other Support and Resistance
One of the most powerful aspects of this strategy is that high-volume nodes rarely exist in isolation. They often line up with other types of support and resistance, and when that happens, the combined zone becomes significantly stronger.
Overlapping Zones Create Stronger Support
For example, a double high-volume node might sit extremely close to a heavy-volume cluster nearby. When those two types of zones overlap, or sit only a tick or two apart, they reinforce each other and create a wider area of support or resistance rather than a single thin line. This gives you more confidence that the zone will hold, and it can also give you a second entry opportunity if price dips slightly further into the overlapping area.
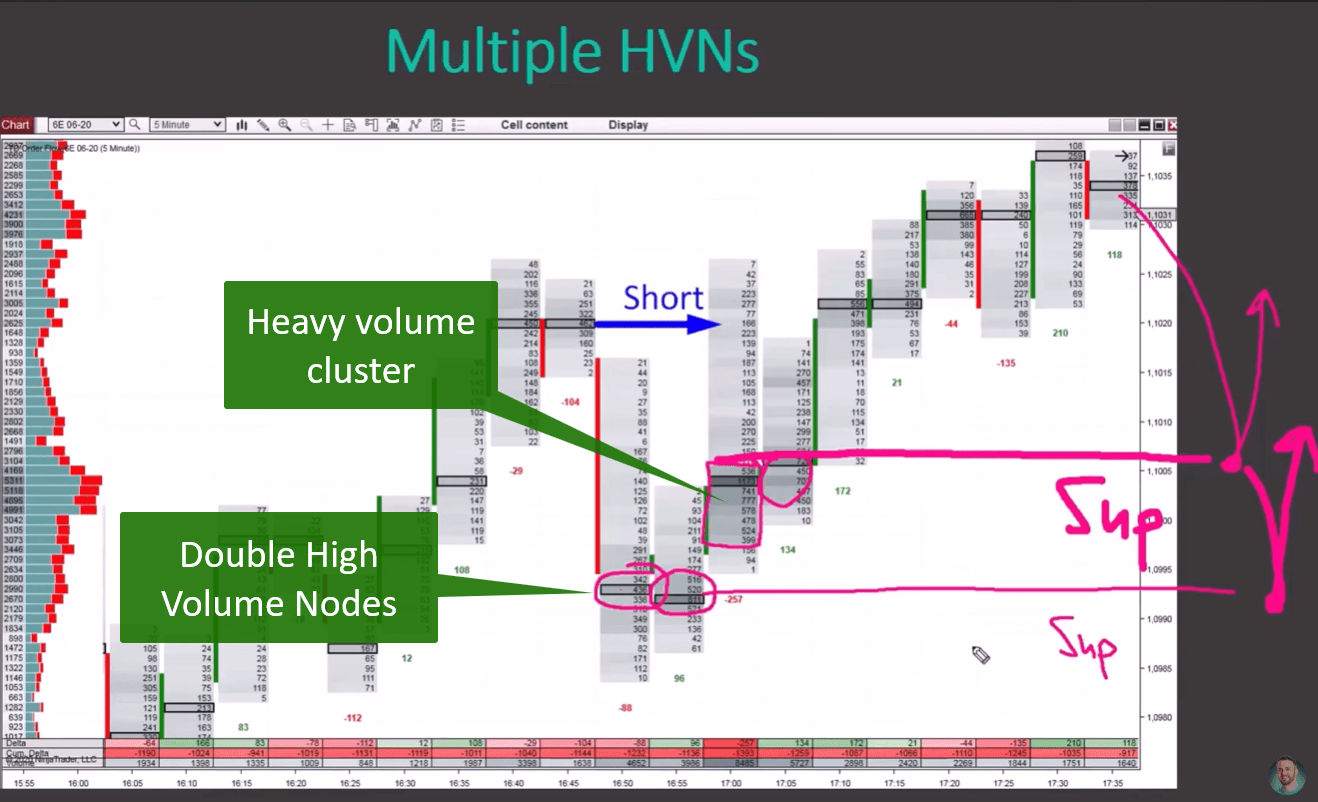
Context also matters a great deal. A double or triple high-volume node that forms within an already important area, such as a rejection of high or low prices, tends to carry more weight than one that forms in the middle of an unremarkable stretch of price action. When you combine high-volume node pullback trading with awareness of the broader structure on your chart, you give yourself a clearer picture of where the highest probability trades are likely to appear.
Final Thoughts
High-volume nodes are one of the clearest ways Order Flow can point you toward genuinely important price levels. A single high-volume node already tells you where the heaviest volume traded within a footprint, but the real strength comes when two or three of these nodes line up next to each other. That kind of cluster shows sustained, heavy participation at a specific price, which usually means institutions were involved and are likely to defend that level again.
High-volume node pullback trading simply means marking that zone, waiting patiently for price to return to it, and entering in the direction of the existing trend. The 30 minute chart tends to work particularly well for spotting these setups, though the 5 minute and hourly time frames can work too, as long as you avoid going higher than the hourly chart.
As you saw in the chart examples, these zones often overlap with heavy-volume clusters or form within already important areas like price rejections, which only adds to their strength. The best part is that this approach translates directly to forex, since it does not depend on bid and ask data at all. With practice, spotting these clusters will become second nature, and you will start seeing them as some of the most dependable pullback zones available in Order Flow trading.
Frequently Asked Questions
Does high-volume node pullback trading work on forex?
Yes. Because this strategy relies on high-volume nodes rather than bid and ask data, it works well on forex pairs in addition to futures markets.
How many high-volume nodes do I need to see before I consider the zone strong?
Two adjacent high-volume nodes is enough to form a valid setup, but three high-volume nodes next to each other is considered an even stronger signal.
What time frame is best for spotting high-volume node pullbacks?
The 30 minute chart tends to offer a good balance, though the 5 minute and hourly time frames can also work well depending on your preference.
What to Do Next
If you want to see this strategy applied live on real charts with full Order Flow breakdowns, explore the video lesson linked above and start practicing spotting high-volume node clusters on your own charts today. Also, check out our courses for a more detailed learning process at Trader-dale.com.
Apply my coupon code KEVIN10 at checkout to get a 10% discount.

ke2u4i
miecws