
Video Transcript
Hey guys, I’ll show you how to trade ES
using Volume Profile and Order Flow. And I’ll demonstrate this using a trade
that I took on the ES yesterday. I’ll show you exactly how the trade went from
A to Z, what I was doing, what I was watching, and how I used Volume Profile
and Order Flow together. Okay? Let’s get to it.
What you see before you is the ES
chart. It is a 30-minute chart, and this is where I always start with the
bigger picture, okay? So, the 30-minute chart, and the bigger picture is Volume
Profile because Volume Profile shows how volumes were distributed throughout
the whole day. So, first, I need to identify strong support and resistance
zones using Volume Profile, and then I’ll be using Order Flow to trade around
them.
So, in this case, I was looking at
this strong sell-off that took place on Friday. This is a heavy volume zone
that formed at the close of the day. And then, on Monday, this is what
happened: a complete reversal. The price went upwards. When I see something
like this, I know that this is an important area because it was a reversal and
a strong rejection of lower prices, right? The price went downwards, turned,
and then went upwards aggressively. So, this is an important area all by
itself.
When I see this, I investigate using
Volume Profile, and what I want to see is a significant volume zone around the
place where the price turned. This is exactly it. See? A significant heavy
volume zone around the place where the price turned. And what I do in a
scenario like this, in this bullish scenario, is draw a line here at the
beginning of that heavy volume zone, and that’s support.
The idea behind this is that once the
price revisits the support again, it will react because the buyers who were
active here, the traders who turned this sell-off into buying activity, will be
defending their long positions here, and that’s why the price should react
there, right? That’s why I’m saying that this is support.
Additionally, to this Volume Profile
setup, which I, by the way, call the rejection setup, there’s also a Fair
Value Gap. Let me show you. A Fair Value Gap comes from Smart Money
Concepts, and it’s right here. And it begins exactly at our level right here.
This is the beginning of the Fair Value Gap. Because this is a bullish Fair
Value Gap, it begins here. And that’s exactly why I placed the level at 7705,
okay? Exactly at the beginning of the Fair Value Gap. As you can see, it nicely
aligns with the beginning of this heavy volume zone.
Afterwards, I was just waiting. I had
my support, and I was waiting. Now, I wasn’t super sure about this support
because, on Monday, this is where the market opened, which was a bit weird,
right? Because it closed here, and then it opened below, down here. So, I
wasn’t super sure about this level. I wanted to see confirmation. I wanted to
see that when the price reaches this level, buyers are jumping in, that big
players see this level, and that they want to jump in and trade at this level.
For that, you want to use Order Flow.
So, when the price is reaching that support, or the level of yours that you are
going to trade, you want to open the Order Flow here and wait for confirmation
that the big players are jumping in. So, that’s what I did, and that’s what
I’ll show you now.
What you see here is a 5-minute chart
of the ES, and this green line is the support that I identified using Volume
Profile. This indicator that you see here is TradingView’s Order Flow. It looks
a bit different from their default Order Flow, but you can set it up yourself
so that it looks exactly like this. I’ll drop a link below this video, and you
can follow it to set it up exactly as I have it, which I think is better than
their default because you can see everything more clearly.
On top of that, there’s also my new
indicator for Order Flow trading. It’s called Big Players Radar. I’ll talk
about it in a second, but now I want to show you how the price reacted to that
support.
So, here is how the price was
dropping towards the support. At this point, it hit that support for the first
time. I was waiting for some kind of confirmation. And, to be frank, I did not
see it here. In this footprint, I did not see buyers jumping in. So, at this
time, I was still without a position, okay? I was waiting.
But what happened next was this
footprint, and that was super important because here I identified strong buyers
jumping in. Let me tell you why. There were a couple of things, a couple of
signals. The first one, the most important one, and let me zoom in so you can
see this clearly, was that there was this sell volume and this sell volume.
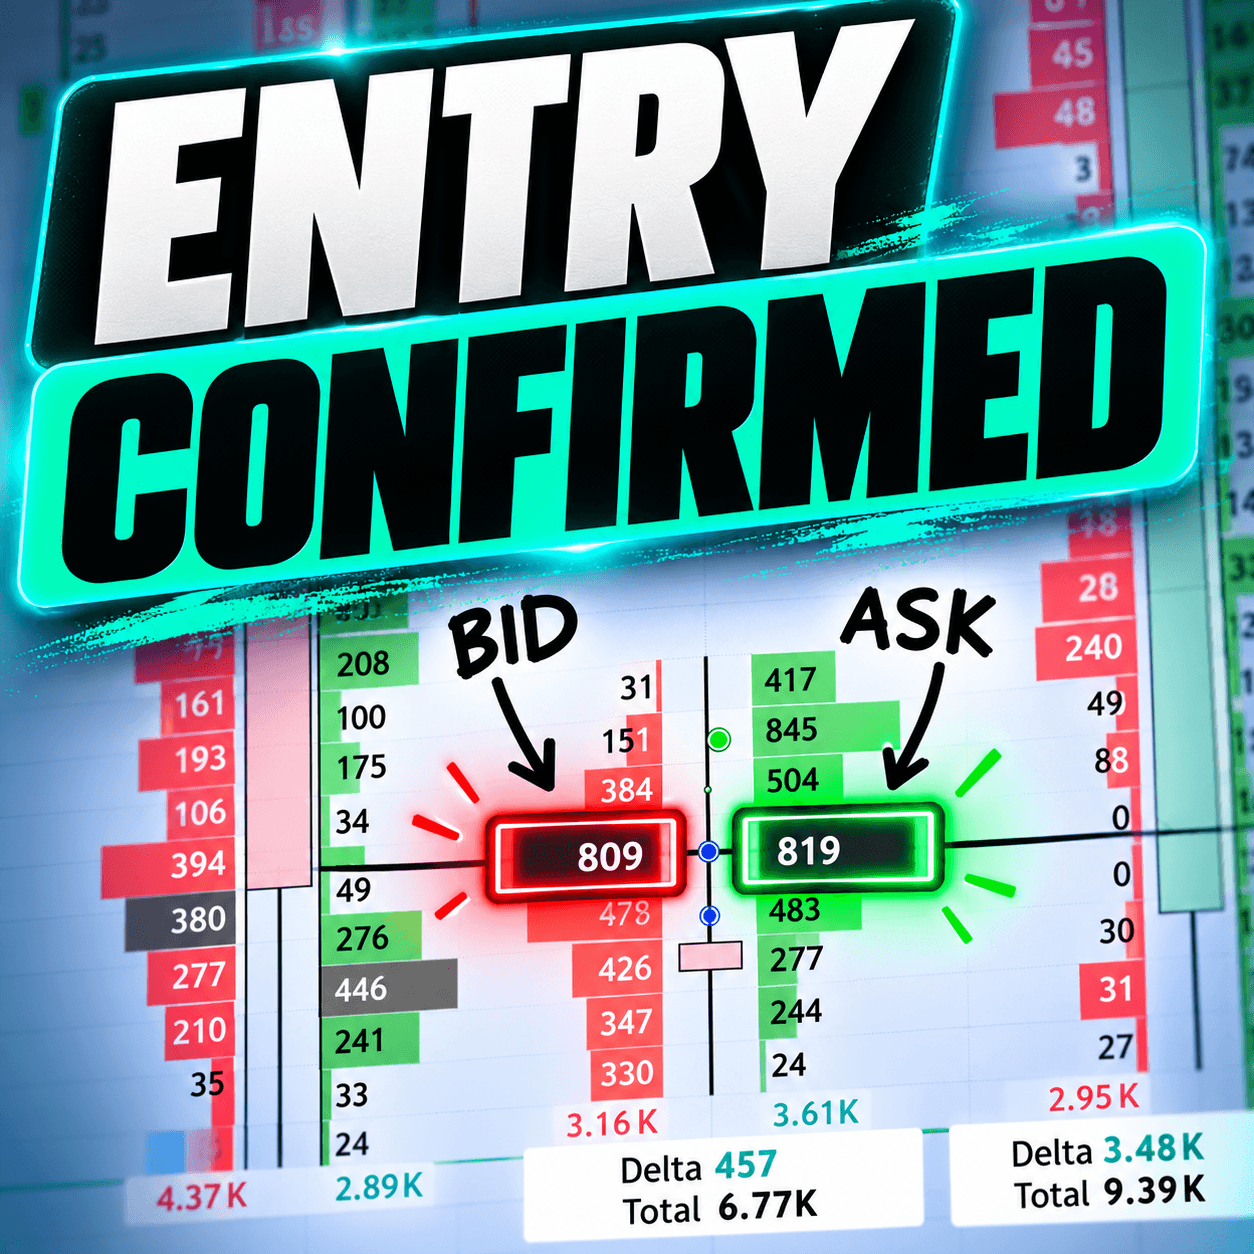
There was unusually heavy volume activity both at the bid and at the ask.
What that means is that the sellers
were pushing the price downwards. Those are the sellers, and that’s what we see
here at the bid: aggressive sellers. But, at the same time, we have unusually
heavy volumes at the ask. That means buyers are buying, right? And it occurred
at this price level. The sellers were selling, but the buyers were buying
everything that the sellers had to sell.
This is an Order Flow setup that I
call the absorption setup. Buyers were absorbing selling pressure. So, that’s
one reason why I decided to jump into this trade.
Now, as I was saying, with the
absorption setup, you want to look for unusually heavy volumes both at the bid
and at the ask. The problem, and what it always was, is how to tell whether
this volume is unusual or not. Is it unusual volume for this session, from the
start of the day, or unusual compared with historical volume? So, it’s always hard
to tell. It was always hard to tell until I developed this indicator, which
draws these little targets here.
The indicator is called Big Players
Radar, and it actually tells you where unusually heavy volumes were traded.
It’s blue, which means that this is absorption because we have heavy volumes
here and here. What it does is look into the past and compare the volume with
the volume at the same time of day to determine whether it is unusually heavy
or not, right? So, if it is, then it will print this little target here and
tell you that this volume, for this specific instrument and this specific time,
is unusual. And that’s how you tell that the big players are jumping in. It’s a
very, very handy thing.
By the way, you can get your hands on
this new indicator. I’ll release it for free to all our members. If you guys
join us, then you’ll get it for free as well in a couple of weeks, when I
release the indicator.
Anyways, we have the absorption here.
That’s the first thing. The second thing that I noticed here is the divergence
between price and delta. That’s the second signal to join the buyers and go
long.
That software I was talking about,
the new software that I’m about to release, will draw this exclamation mark
here if there’s a divergence between delta and price. Delta essentially means
the difference between aggressive buyers and aggressive sellers. In this case,
you can see that the delta was positive. That means aggressive buyers were
dominating in this specific footprint, but, at the same time, we have a bearish
candle, right? And that’s the divergence. That’s why there’s that exclamation
mark, right? That’s signal number two.
Even though the price is still
dropping at this time, we know that buyers are jumping in, and they’re actually
dominating in this footprint. So, that’s signal number two.
After that, we can see unusually
heavy volumes at the ask. See those two targets here, or those two circles
here? That’s unusually heavy volume, and it’s green because it’s at the ask.
That means aggressive buyers, right? Those guys. Those guys.
So, first, there was the absorption,
and then aggressive buyers started to jump in. Everything is pointing to buyers
jumping in, and the important thing is that it’s pointing to big players, not
just small retail traders, but big players. That’s important. So, big players
are jumping in. That’s why I pulled the trigger. I did it here when I saw the
absorption. That’s the point from which I went long.
But that’s not all. That’s just the
entry confirmation, but what about stop-loss and take-profit placement? That’s
also very important. For that, I like to go back to the big picture, the Volume
Profile. So, now we’re back at the 30-minute chart, and I’ll show you how to
place your stop-loss and take-profit.
Again, what we see here is this heavy
volume zone that the support level was based on. This was the support level.
The way I place my stop is that I always place it behind a barrier. In most
cases, the barrier is a heavy volume zone, like this one. So, I place the stop
behind it, right here. That was the stop-loss.
This whole area, the place where the
volumes were heavy, is a barrier, right? This whole area. And the stop should
be behind it because if the price goes past the barrier, there’s no way of
telling where the price might stop next, okay? So, that’s why the stop should
always go behind a barrier.
Now, what about the take-profit? The
take-profit should always go before a barrier. What I saw here, and what was
standing in the way of this long trade, was this heavy volume zone. Because I
went long from here, this heavy volume zone was standing in the way, and I was
afraid that the price might actually react to this heavy volume zone and turn
downwards. That’s why I exited the trade here before the price had a chance to
actually turn at this potential resistance.
At this time, I didn’t know that the
price would just continue past that resistance as if it wasn’t even there. I
did not know that. But there was a risk that the price might react to this
heavy volume zone because the price likes to react to heavy volume zones,
right? So, there was a risk, and I did not want to take it.
That’s why I exited the trade here,
before the first barrier standing in the way. And that’s how I do it. I place
my stop-loss behind a barrier, and I place my take-profit before the first
barrier standing in the way, like this.
Now, if you guys would like to learn
how I trade with Volume Profile and Order Flow from A to Z, including my
complete strategy, then I recommend visiting my website and taking advantage of
a special deal that we currently have. The website is Trader-Dale.com, and if you click the
button that says “Trading
Course and Tools” it’ll take you to this page. It’s a special
Halloween page because we’re running a special Halloween sale. Here, you can
get one of my courses, or you can scroll down a bit and take advantage of the
special Halloween sale.
That means you can get all four packs
together as one huge combo at a discounted price: just $697, available only
until the end of the month. And, by the way, if you like the Big Players Radar
indicator, you get that for free as well.
All right, so anyways, thanks for
watching the video. I hope you guys liked it, and I’ll look forward to seeing
you next time. Until then, happy trading!
