If you’ve ever looked at a Volume Profile on your chart and wondered what that shape is actually telling you, you’re not alone. Understanding how to read Volume Profile shapes is one of the most practical skills you can develop as a trader. In this article, you’ll learn exactly what the four main Volume Profile shapes mean : D, P, B, and Thin, and how each one tells you whether buyers or sellers are currently in control of the market. No guessing, no vague signals. Just clear, visual information straight from the chart.
Drawing on the methodology of Trader Dale and real chart examples, this breakdown covers each profile shape step by step. By the time you finish reading, you’ll be able to look at any Volume Profile and immediately understand the story behind the price. Let’s start from the beginning.
Table of Contents
Key Takeaways
- The D-shaped Volume Profile means the market is balanced — neither buyers nor sellers are in control.
- The P-shaped Volume Profile means buyers are in control and the price may trend upward.
- The B-shaped Volume Profile means sellers are in control and the price may trend downward.
- The Thin Profile signals a strong, fast-moving trend driven by one dominant side of the market.
- Always confirm P and B shapes by checking where the price closes relative to 50% of the daily range.
What Is a Volume Profile? (And Why Shape Matters)
Before we break down each shape, it helps to understand what a Volume Profile actually is. A Volume Profile is a charting tool that shows you how much trading activity happened at each price level over a given time period. Instead of just showing you what the price did, it shows you where the most trading happened — and that distinction changes everything.
Think of it this way. If a lot of traders were buying and selling at a specific price, that level becomes significant. The market spent time there because both buyers and sellers agreed it was fair. That activity shows up on the Volume Profile as a wide bar at that price level. Conversely, a thin bar at a price level means the market moved through quickly, with very little trading happening there.
SHAPE
The shape of the overall Volume Profile when you step back and look at it as a whole is what gives you your market reading. Different shapes emerge under different market conditions, and each signals a specific balance of power between buyers and sellers. That’s the insight this article focuses on.
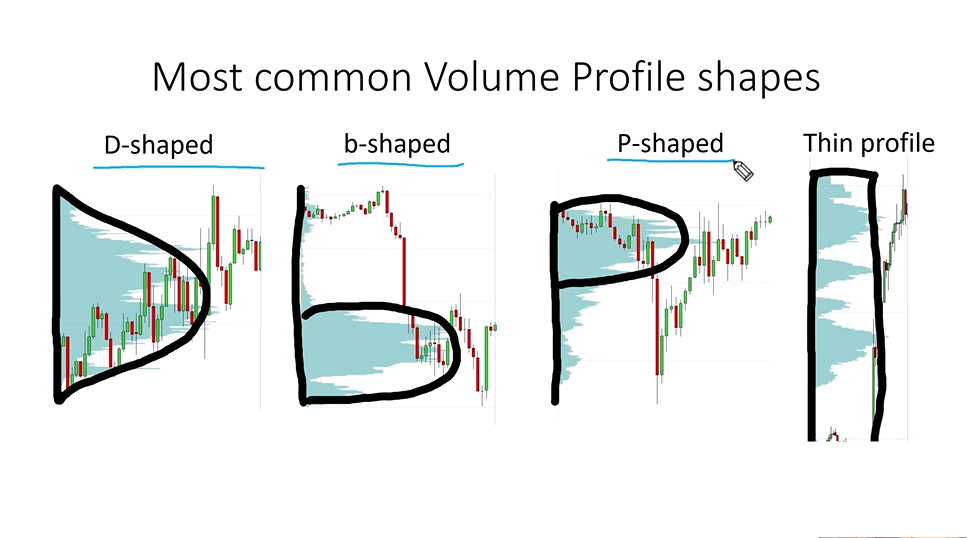
There are four main Volume Profile shapes you need to know: the D-shape, the P-shape, the B-shape, and the Thin profile. Each one tells a different story, and together they cover virtually every market condition you’ll encounter. Importantly, these are daily profiles, a new one prints on your chart every day, giving you a fresh read on what happened during that session.
The Point of Control (POC) — the price level with the highest volume plays an important role in reading these profiles. Its position within the profile (high, middle, or low) is part of what defines the shape you’re looking at. You’ll see this come up repeatedly as we go through each profile type.
Understanding these four shapes doesn’t require memorizing complicated formulas or watching charts for hours. Once you see them clearly, they become instantly recognizable — and that recognition becomes a repeatable edge in your analysis.
The D-Shaped Volume Profile: When the Market Takes a Breath
What it looks like: A wide, bell-shaped distribution just like the letter D, with the heaviest volume somewhere in the middle and the Point of Control roughly centered in the profile.
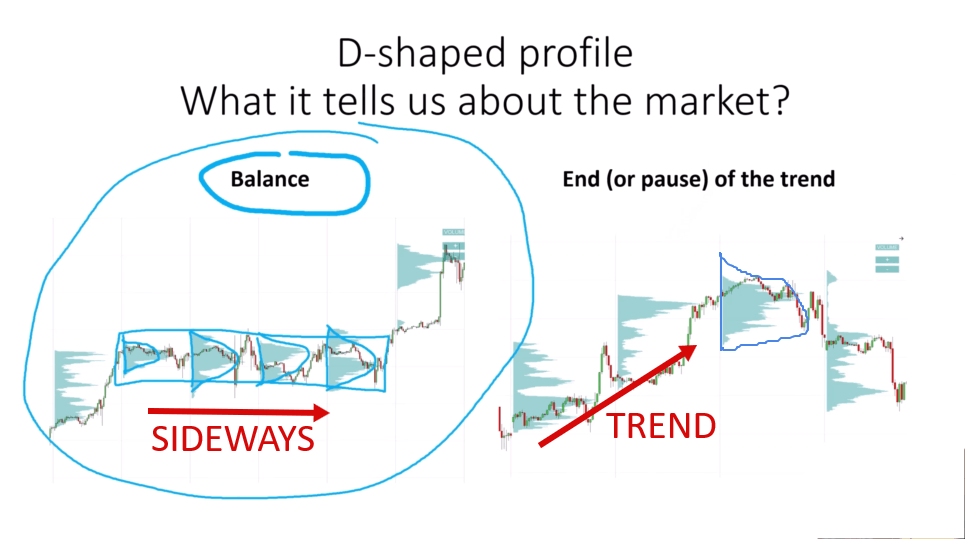
What it means: The market is balanced. Buyers and sellers are in agreement.
The D-shaped Volume Profile is by far the most common shape you will see on any chart. The reason is straightforward: markets spend roughly 70% of their time moving sideways, and whenever the market moves sideways, a D-shaped profile tends to form. This shape is the market’s way of telling you that the current price range is accepted by both sides — no one is being forced out, and no one is aggressively pushing price in either direction.
When you see a D-shaped profile, think of it as a moment of rest. The market has been active, positions have been established, and now buyers and sellers are essentially in equilibrium. Neither side is dominating. The widest part of the D — where the most volume traded — is usually close to the middle, and this becomes the Point of Control for that session or period.
Two Important Things the D-Shape Tells You
- The market is in a sideways (ranging) phase. If you look at a chart with several D-shaped profiles in a row, the price is likely moving horizontally within a range. This is the most common interpretation. Traders who operate within ranges look for the edges of this D — the Value Area High and Value Area Low — as potential trade locations.
- A trend may be pausing or ending. This is an important secondary reading. If the price was in an uptrend and suddenly forms a D-shaped profile, it means the aggressive buying has slowed down. Buyers and sellers have found a temporary equilibrium. This could mean the trend is pausing before continuing, or it could be an early signal that the trend is reversing. On its own, the D-shape doesn’t confirm which — but it tells you to pay attention.
The D-shaped profile is often imperfect in real charts. It won’t always look like a textbook letter D. What you’re looking for is a roughly symmetrical distribution with the heaviest volume near the middle. Slight variations are normal and don’t change the interpretation. The key is to identify whether the market is in a state of balance — and the D-shape is your signal that it is.
One practical tip: when you see D-shaped profiles appearing after a strong directional move, it’s worth waiting for the market to declare its next intention. Volume Profile shapes don’t predict the future; they describe the current state. But knowing the market is balanced helps you avoid jumping into a trend that may already be losing momentum.
The P-Shaped Volume Profile: Buyers Are Stepping In
What it looks like: Heavy volume at the top, thin volume at the bottom — just like the letter P. The Point of Control sits in the upper portion of the profile.
What it means: Buyers are in control.
The P-shaped Volume Profile is one of the clearest signals you can get from this tool. When you see heavy volume concentrated at the top of the profile and a thin tail at the bottom, it tells you that the market rejected lower prices. Buyers stepped in aggressively and pushed the price upward. The result: a profile that’s wide at the top and narrow at the bottom — the letter P. This is the signature of bullish market behavior.
How a P-Shape Forms
There are two common ways a P-shaped profile develops during a trading session or period:
Scenario 1 — Strong rejection of lower prices: The price drops early in the session, finds no seller interest at those low levels, and then reverses sharply upward. Buyers flood in, volume builds at the top, and the profile ends up with that characteristic P shape. This rejection pattern is a powerful signal that lower prices simply aren’t accepted by the market.
Scenario 2 — Steady uptrend throughout the session: The price opens and moves steadily higher, building volume as it goes. Since the market spends most of its time at higher prices (where the most activity is happening), the profile naturally fills in at the top. By the end of the session, you have heavy volume at the top and very little at the bottom — the P-shape.
Two Things the P-Shape Signals
- The market is in an uptrend. If you see multiple P-shaped profiles forming consecutively, you’re looking at a bullish market. Each profile is confirming that buyers are showing up consistently and driving the price higher. This is one of the cleanest trend-confirmation signals you can get from Volume Profile.
- A downtrend may be ending. If the price has been falling for a period and then forms a P-shaped profile, it could be signaling that buyers are starting to take control. The lower prices triggered buying interest, the price rejected those lows, and the profile has printed with heavy volume at the top. This doesn’t guarantee a full reversal, but it’s worth treating as a potential turning point.

The 50% Rule for P-Shaped Profiles
This is a critical validation rule. A P-shaped profile is only considered valid when the price closes above 50% of the daily range. Why does this matter? Because visually, a profile might look like a P — but if the price ended up closing in the lower half of the day’s range, the buyers didn’t actually maintain control. The shape was created but not confirmed by where price finished.
Always check the closing price relative to the midpoint of the daily range. If the price closed below that midpoint, the profile doesn’t carry the same bullish signal, even if the shape looks right. This simple rule filters out false readings and keeps your analysis honest.

The B-Shaped Volume Profile: Sellers Are Taking Over
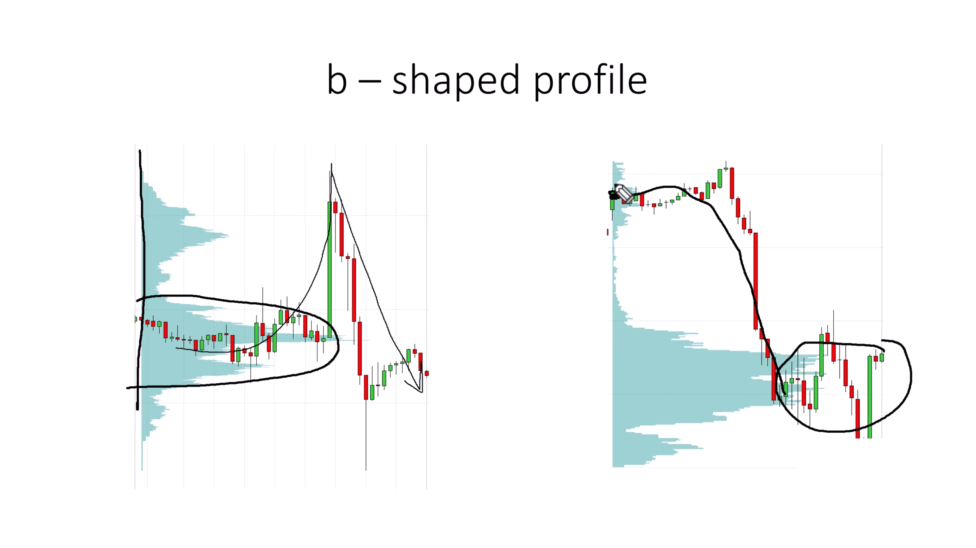
What it looks like: Heavy volume at the bottom, thin volume at the top — the mirror image of the P-shape, and it looks like the letter B. The Point of Control sits in the lower portion of the profile.
What it means: Sellers are in control.
The B-shaped Volume Profile is the direct opposite of the P-shape, and once you understand one, the other is easy to read. Where the P-shape shows buyers pushing prices up and rejecting lows, the B-shape shows sellers pushing prices down and rejecting highs. Volume is heavy at the bottom, thin at the top, and the overall shape mirrors the letter B.
How a B-Shape Forms
Just like the P-shape, the B-shaped profile forms in two distinct ways:
Scenario 1 — Rejection of higher prices: The price moves up early in the session, gets rejected at the top, and then drops sharply. Sellers dominate the rest of the session, building volume at lower price levels. The result is a profile that’s wide at the bottom and thin at the top, the B-shape.
Scenario 2 — Steady downtrend throughout the session: The price opens and moves steadily lower throughout the session. Volume accumulates at lower prices because that’s where the market spends most of its time. By the end of the period, the profile has heavy volume at the bottom and light volume at the top again, the B-shape.
Two Things the B-Shape Signals
- The market is in a downtrend. Multiple consecutive B-shaped profiles are a strong indication of sustained selling pressure. Each one confirms that sellers are consistently in control and the price is moving lower. This is the bearish counterpart to the series of P-shapes you see in an uptrend.
- An uptrend may be ending. If the price has been rising and then prints a B-shaped profile, it’s a warning sign. Sellers have stepped in and are beginning to dominate. The uptrend may be stalling or reversing. Combined with other context on your chart, key resistance levels, for instance, a B-shaped profile at the top of a trend, is worth taking seriously.

The 50% Rule for B-Shaped Profiles
Just as with the P-shape, the B-shaped profile has its own validation rule: it is only valid when the price closes below 50% of the daily range. If the price closed in the upper half of the day’s range, the sellers didn’t fully maintain control despite the visual appearance of a B-shape. This is the same logic applied in reverse — the closing price must confirm that sellers actually won the session.
Applying this rule consistently makes your readings more reliable. It’s very easy to see a shape that looks like a B and immediately assume bearish conditions — but the 50% close rule adds a necessary layer of confirmation. This is the kind of detail that separates a disciplined reading of Volume Profile from a loose visual interpretation.

The Thin Volume Profile: One Side Is Dominating
What it looks like: A narrow, elongated profile with no single dominant volume zone. Instead of one heavy area, you see several smaller volume clusters spread across a wide price range.
What it means: The market is moving fast. One side, either buyers or sellers, is completely dominating.
The Thin Volume Profile is the most visually distinct of the four shapes because it looks nothing like the others. While the D, P, and B shapes all have identifiable areas of heavy concentration, the Thin Profile is exactly what it sounds like: thin. The volume is spread out, there’s no clear Point of Control that stands out dramatically, and the overall shape is narrow from top to bottom.
Why Thin Profiles Form: The Speed Factor
To understand why the Thin Profile looks the way it does, you need to understand what happens when markets move quickly. In normal market conditions, price moves slowly enough that large institutional traders, banks, funds, and other big players can place their substantial orders at specific price levels. This activity creates heavy volume at those levels, which is what gives D, P, and B shapes their characteristic wide zones.
When the market is moving fast, driven by a major news event, earnings release, central bank decision, or a powerful momentum breakout, large institutional players don’t have enough time to place their full orders at any single price level. The price is moving through levels so quickly that orders are distributed across a wide range. The result: no single area of heavy concentration, and a profile that appears thin and relatively even from top to bottom.
This is why Thin Profiles are often associated with macro news events. When the market reacts to unexpected economic data or a significant geopolitical development, price can move 1%, 2%, or more in a very short time. Volume gets spread across all those price levels rather than concentrating, creating that characteristic thin appearance.
What the Thin Profile Tells You
The message from a Thin Profile is simple and direct: there is a strong, aggressive trend in motion. Either buyers are pushing the price up with intensity and urgency, or sellers are driving it down with force. One side of the market is clearly dominating, and the other side is either absent or overwhelmed.
This is useful information for several reasons. First, it tells you that the current move has real conviction behind it. This isn’t a slow drift in one direction. Second, it tells you to be cautious about trading against the trend. When a Thin Profile forms, the dominant side is clearly in charge, and fighting that momentum is generally a low-probability approach.
Third, and perhaps most practically, Thin Profiles often signal areas of low support or resistance. Because volume was thin at those price levels when they were first created, the market didn’t establish strong value there. If price returns to a Thin Profile area in the future, it may move through it quickly again, just as it did the first time.
Look for Thin Profiles on days when there’s major scheduled news (central bank meetings, economic data releases, earnings reports) or when a sudden event causes a sharp reaction. Once you recognize the conditions that create them, you’ll start to anticipate when they might appear.

Quick-Reference Summary: The Four Volume Profile Shapes
Use this table as a quick reference when you’re analyzing charts. A single glance at the shape of the Volume Profile should immediately orient you to the market’s current condition.
Profile Shape | Looks Like | Market Signal | What It Means |
D-Shaped | Letter D | Balanced Market | Buyers and sellers are comfortable — sideways market |
P-Shaped | Letter P | Buyers in Control | Uptrend forming or downtrend reversing |
B-Shaped | Letter B | Sellers in Control | Downtrend forming or uptrend reversing |
Thin Profile | Narrow bar | Strong Trend | Fast-moving price, one side dominating |
One important thing to keep in mind: these shapes work best when used in context. Volume Profile shapes don’t exist in isolation — they are part of a larger picture that includes price levels, support and resistance, trend structure, and market session dynamics. A D-shape in the middle of a strong uptrend is read differently from a D-shape at a major resistance level. The shape gives you the starting point; your analysis fills in the rest.
Conclusion: Start with the Shape, Then Ask Why
Volume Profile is one of the most information-rich tools available on a trading chart. But it only becomes useful when you know how to read it, and reading it starts with recognizing the shape.
D-shape: balance. The market is resting, and buyers and sellers are equal. P-shape: buyers. The market rejected lower prices, and buyers are in control. B-shape: sellers. The market rejected higher prices, and sellers are in control. Thin profile: momentum. One side is dominating, and the move is fast and aggressive.
These four shapes give you a clear, simple framework for reading market conditions without relying on guesswork. They don’t tell you what to do next; trading decisions involve much more than a single signal, but they tell you exactly what is happening right now, and that clarity is genuinely useful.
The best way to improve at reading Volume Profile shapes is to go back through your charts and identify past examples of each shape. Look at what happened before and after. Over time, pattern recognition becomes intuitive, and you’ll be able to read a Volume Profile shape almost instantly. That kind of quick, accurate market reading is a real advantage.
Frequently Asked Questions (FAQ)
Q: How do I know which Volume Profile shape I'm looking at if it doesn't look perfect?
Real-world profiles are rarely textbook-perfect. A D-shape might be slightly skewed, or a P-shape might have a small secondary volume cluster at the bottom. The key is to look at where the majority of volume is concentrated. If the heaviest volume is roughly in the middle and the profile is relatively symmetrical, that’s a D. If the heaviest volume is clearly at the top, that’s a P. Focus on the overall weight distribution, not the exact visual shape.
Q: Can a single day's Volume Profile be different from the weekly or monthly profile?
Yes, absolutely — and that’s actually one of the most powerful aspects of Volume Profile analysis. A single day might show a P-shaped profile (buyers in control for that day), while the weekly profile might be D-shaped (the market is balanced over the full week). Reading multiple timeframes of Volume Profile simultaneously gives you a much richer picture of market structure. Just be clear about which timeframe you’re reading and what it tells you about conditions on that specific time scale.
Q: Do Volume Profile shapes work the same way on all markets — stocks, forex, crypto, futures?
The principles behind Volume Profile shapes apply across markets, because they reflect universal buyer and seller behavior. However, Volume Profile is most reliable on markets with high liquidity and accurate volume data — futures markets and stocks tend to provide the most reliable volume figures. Forex spot volume data can be less accurate since it typically reflects tick volume rather than actual traded volume. Crypto markets can also have data quality issues depending on the exchange. The shapes and their interpretations remain valid, but the quality of your Volume Profile tool is only as good as the quality of the volume data feeding into it.
Want to Go Deeper with Volume Profile? Visit trader-dale.com to access full Volume Profile trading strategies, custom indicators, and step-by-step packs that show you exactly how to apply everything you’ve learned here. → Explore Volume Profile Trading Packs at trader-dale.com |