
Hello guys,
today’s analysis is going to be a bit different from what you are used to. This time I will elaborate on a question I got from one member of my trading course. It was a really good question and I think you guys could also find the answer interesting and helpful.
The question was related to trading the USD index with Order Flow.
He was in a Short position from a place which he marked by the blue arrow:

At first, it all looked good but then the price reversed, went upwards and he got stopped out.
His question was if there had been a way to recognize something has gone wrong. Some indication that the price would turn upwards…
In my opinion, this was a good trade and there were good signs that the selling activity would continue. Let’s now focus on those good signs.
Signs of Sellers
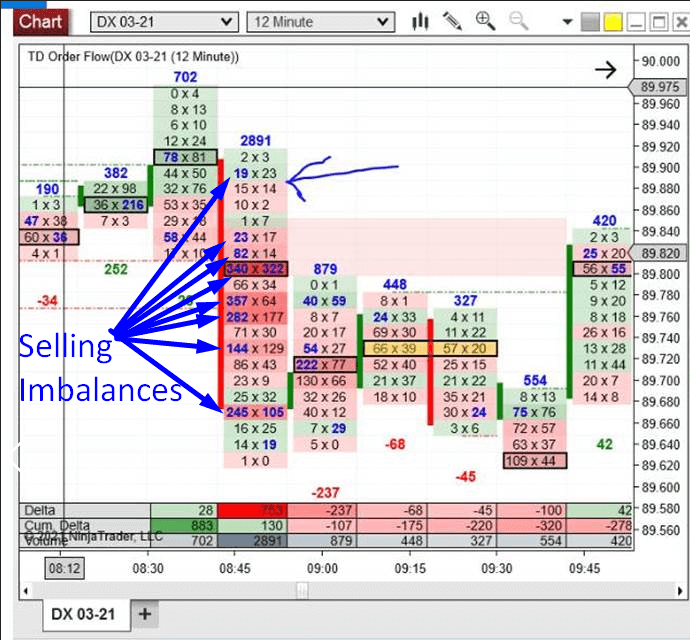
1st good sign was many Selling Imbalances (the blue numbers). If they show on the Bid (left side of the footprint), then they tell us, that the Sellers are in control and they are way stronger than Buyers.
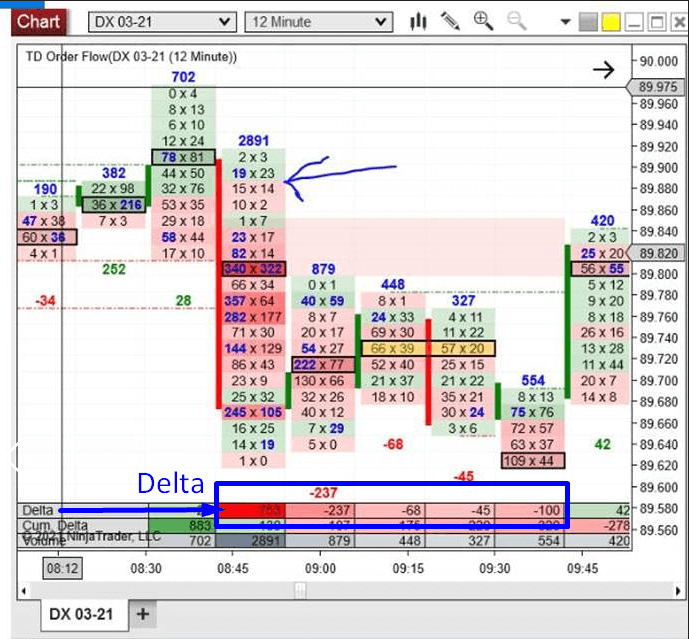
Another good sign was negative Delta in the footprints (this tells that there are more contracts traded on the Bid and that Sellers are more aggressive). Delta shows below each footprint.
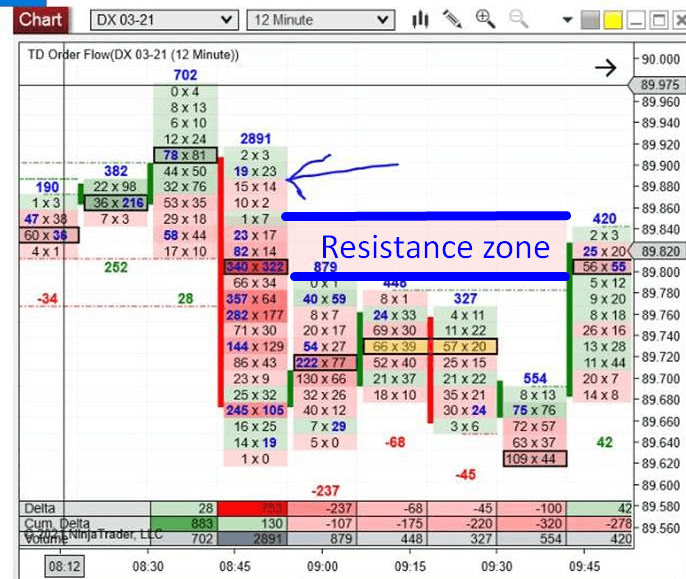
Another thing to notice is Stacked Imbalances (three or more Selling Imbalances are stacked at the top of each other). My software highlights such areas and they represent Supports/Resistances.
As the price was dropping, it created such a zone around 89.82.
Warning: Signs Of Buyers
So far, all was good but then things turned sour.
This is the important part – the part where you can learn how to recognize how to identify a trade that is starting to go wrong.
There were two things to notice here.
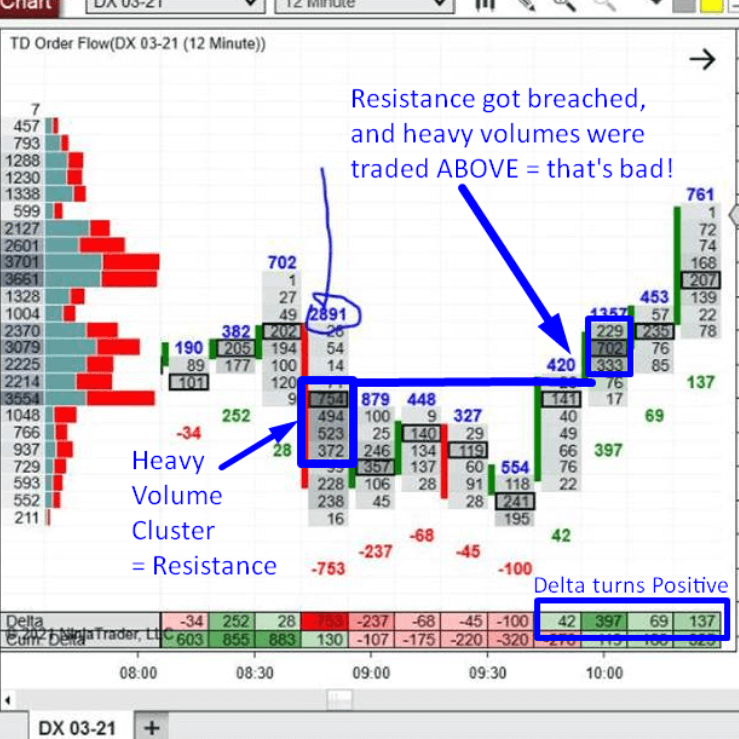
The first thing, was that Delta turned positive. This indicates that Buyers suddenly became stronger and more aggressive.
If this was just the only thing to show, then it would not necessarily mean that the trade is getting bad and we should quit it. Even in a strong downtrend you can usually spot places with positive Deltas.
The second warning was that a heavy Volume Cluster and the Resistance created by Stacked Imbalances (that’s the red highlighted zone) got both breached and new heavy volumes got formed above that.
I best show you in a picture. This time it is the same area, only a bit zoomed out and with a different Order Flow setting (showing Total Volumes in the Order Flow cells):
*Click the picture to enlarge
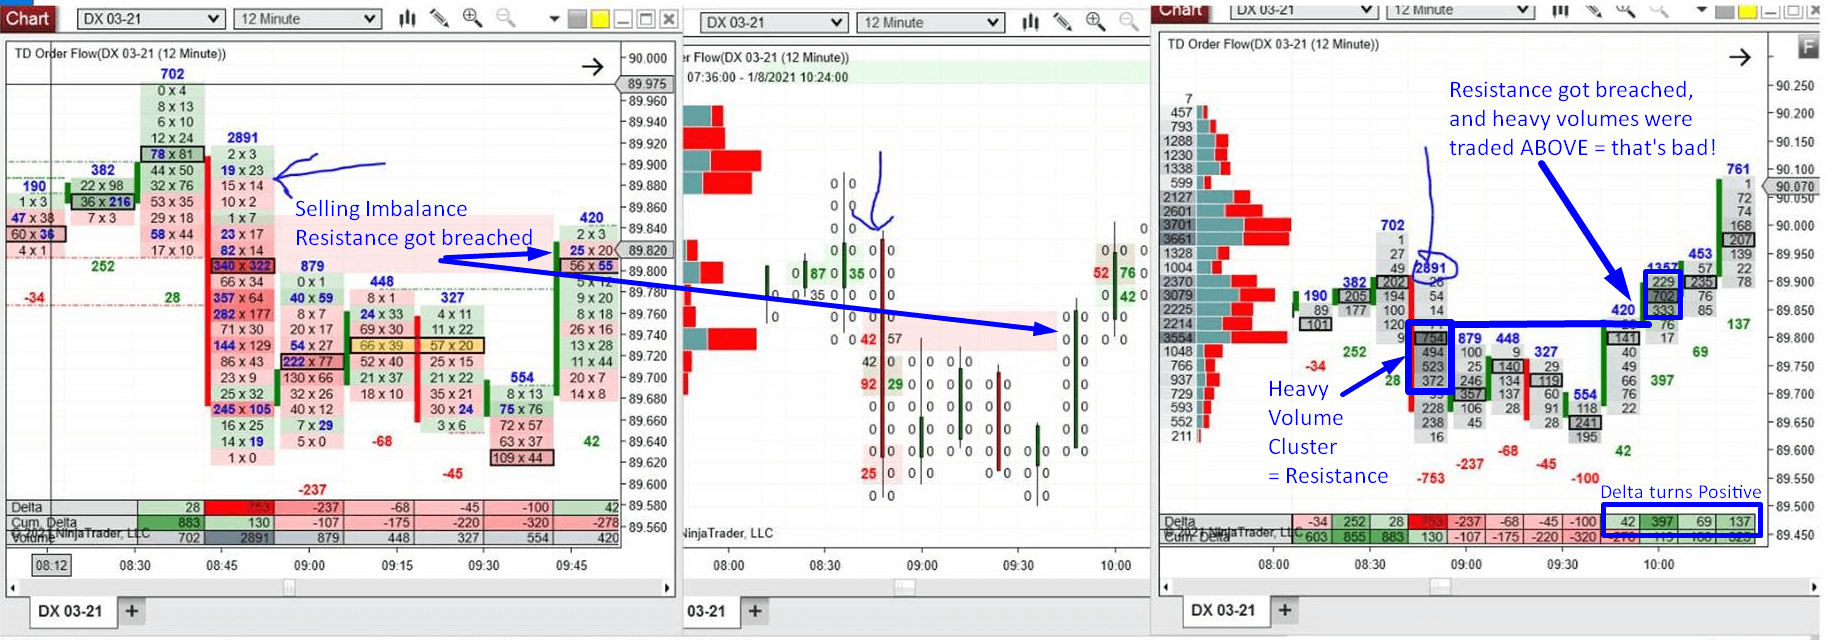
The final signal to quit the trade was when heavy Volume Cluster got breached (It should have held, because it was a Resistance), and a new heavy Volume Cluster got formed above it.
Another piece to the puzzle was the rising Delta and a breach of the Selling Imbalance area.
I hope you guy’s liked today’s not really standard trade analysis. Let me know if you liked it in the comments below!
Learn More About Order Flow Trading
If this analysis was too complicated for you to understand, then you can pick up my new Order Flow book by clicking the link below. The book will teach you all the basics, terminology as well as Order Flow strategies I like to use.
I am sure you will find it very useful and that you will like it even if you have never heard or tried Order Flow before.
Get it here: Order Flow: Trading Setups
Have a GREAT weekend!
-Dale
Thanks, Dale this helps a lot, I’ve just purchased OF so I’m working through the course and your new excellent book on OF.
That’s awesome to hear buddy, thank you!
Thanks Dale, this was very useful. So much to learn about order flow – I love it!
Peter
I’m glad you liked it Peter!
Dale,
Looking for to reading OF. Just purchased the Elite Pack . Looking forward to the course.
Glad to have you here Brent!
I had trouble withdrawing, but thanks to the team at (NETTRACEPRO NET) all my pending withdrawals were successfully processed. These guys work around the clock to keep things running smooth for customers. I’m grateful for their effort.
109 contracts on bid at low (to me it is big buy limit). thats a big warning against short trades.