Do you prefer a video? Check this out:
This article is the second part of a four-part Beginners Guide to Order Flow. Here are links to all parts:
In this article, I would like to show you some special features which I implemented into my Order Flow software.
Those special features make trading and reading the Order Flow a lot easier as well as allowing you to see things which you would otherwise miss. Let’s have a look at them one by one!
Order Flow for Forex
One of the most important features of my Order Flow software is that you can use it for trading Forex. This is not very common, because Order Flow is usually used with centralized data (Futures).
Still, NinjaTrader has a good Forex data feed with reliable volume information. We were able to use this and adjust the Order Flow to work even with Forex!
The Forex data that is provided does not give Bid and Ask, but only Volume (=sum of Bid and Ask). For this reason you cannot use all the functions when trading Forex. Still the Volume data is extremely useful and the Order Flow gives you a great edge even without Bid and Ask.
Order Flow used with Forex Volume data looks like this:
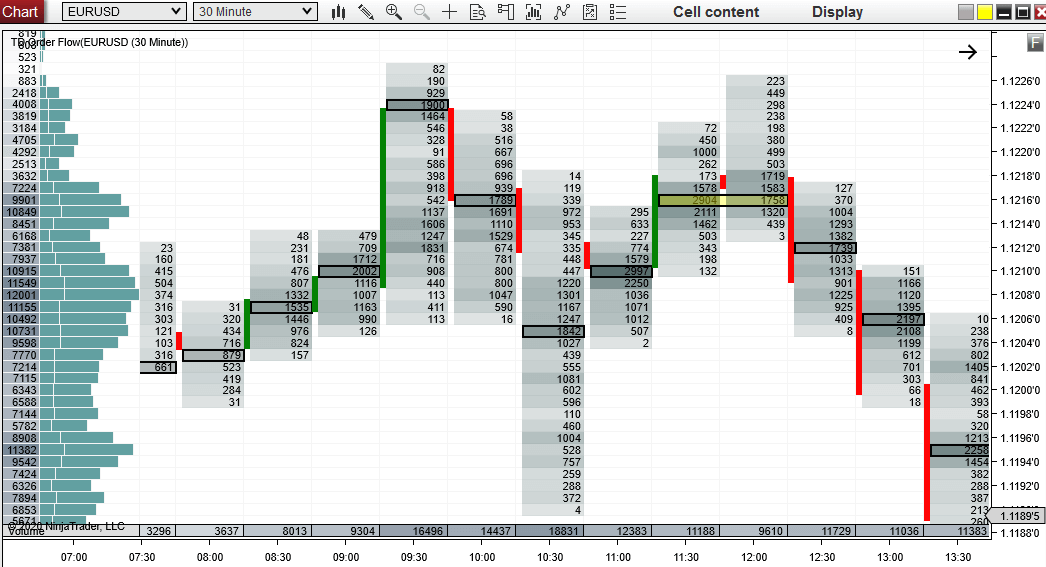
Every cell shows the volumes that were traded at the given price level. The heavier the volumes, the darker the shade.
Volume Clusters
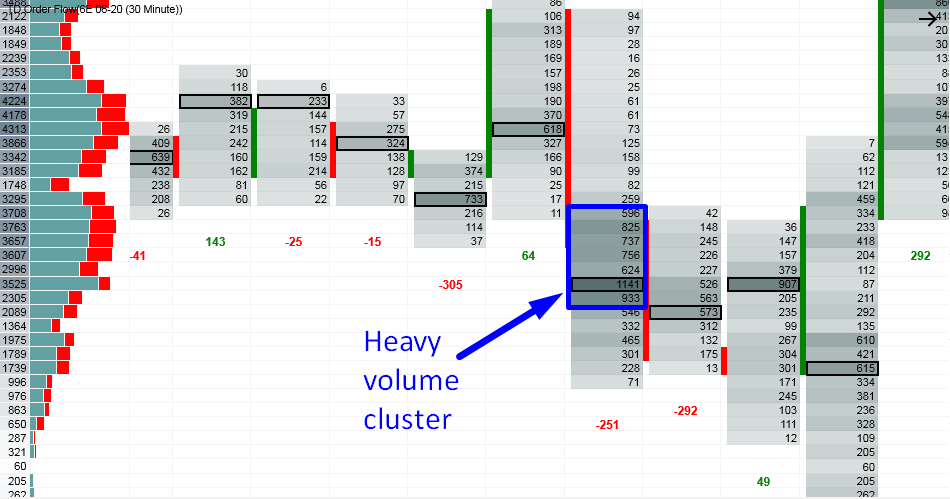
When trading with the Order Flow it is very important to pay attention to heavy volume areas and low volume areas. This would be almost impossible if you just looked at the numbers in each cell.
For this reason, I designed my software to recognize heavy volumes and use darker colors to make them stand out. This way you can immediately identify heavy volume areas by just quickly checking the chart.
When there is an area which is way darker than the surrounding areas, then it marks a place where the BIG trading institutions and their algorithms were trading.
Those are very important areas to keep track of as they often represent strong areas of support and resistance.
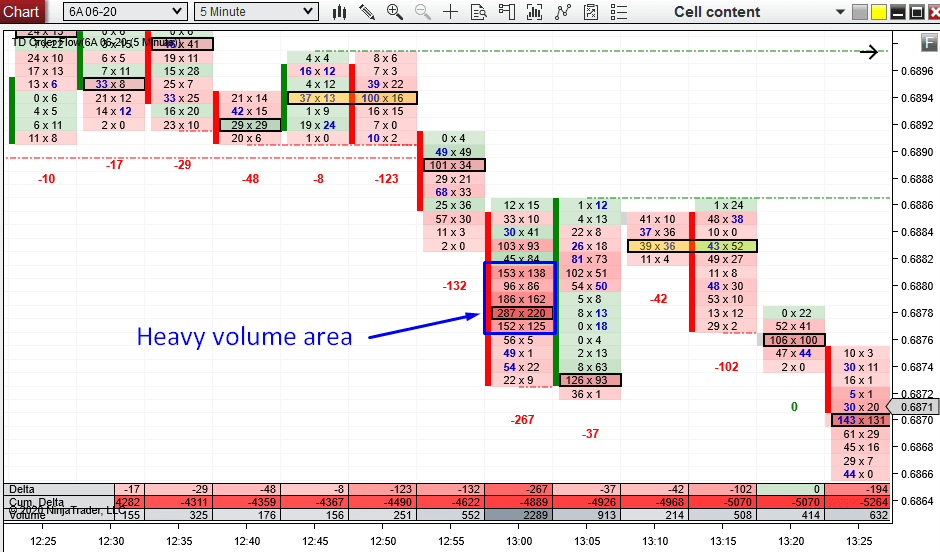
Those Darker areas are also shown on the Bid x Ask visualization as in the chart below.
The heavier the volumes, the darker the color:
Recommended Forex Broker
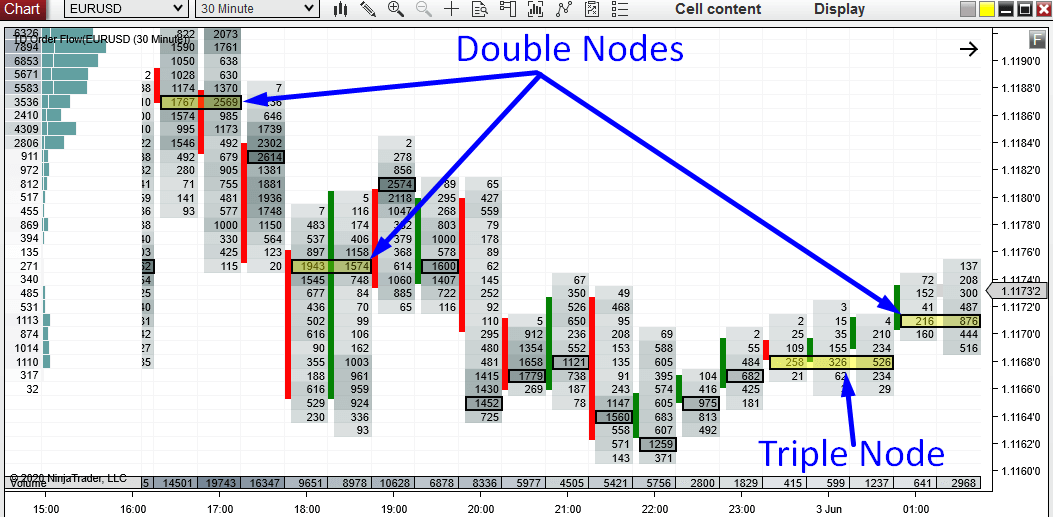
Multiple High Volume Nodes (HVN)
A very important place in every footprint is the High Volume Node. It is the place where most of the volumes got traded (Bid and Ask combined).
An especially strong level is formed when two or more High Volume Nodes meet at the same price in consecutive footprints. When two nodes meet I call it a Double Node, when it is three nodes, then a Triple Node, etc,…
My software automatically detects those Multiple HVNs and highlights them in yellow. This way you can quickly identify them at first sight.
Those Multiple HVNs are very important in my Order Flow analysis because they often represent a strong Support and Resistance zones.
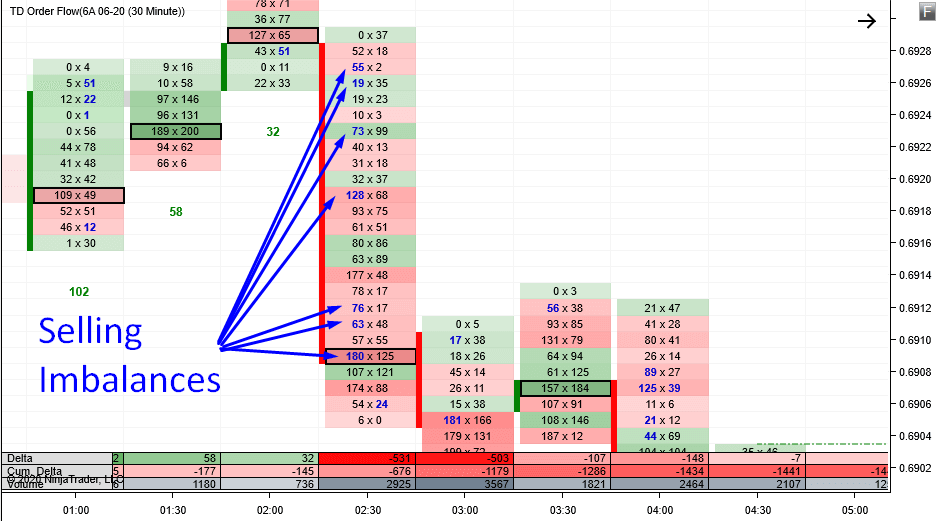
Imbalances
An Imbalance is when Buyers are way more aggressive than Sellers or Sellers could be more aggressive than Buyers.
If Buyers are way more aggressive than Sellers, then the number on Ask is printed in BLUE.
If Sellers are more aggressive than Buyers, then the number on Bid is printed in BLUE.
You will often see imbalances at the start of a strong and aggressive trend, as well as within the trend itself.
Imbalances are a great way how to keep track of the market sentiment. Only with order flow do you see this type of critical market detail!
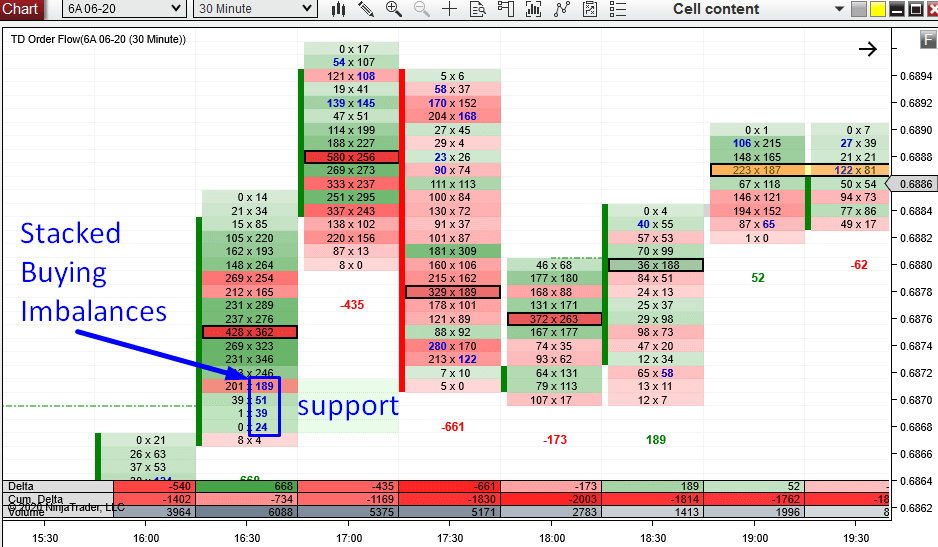
Stacked Imbalances
Stacked Imbalances are three or more cells with imbalances at top of each other. Learning to spot these areas provides extremely important information to us as traders.
Stacked Imbalances are a sign that one side of the market (buyers or sellers) is dominating and in complete control. Those buyers or Sellers are really strong, aggressive and determined to push the price their way.
My Order Flow software automatically highlights areas with Stacked Imbalances. Those areas represent strong Support and Resistance zones.
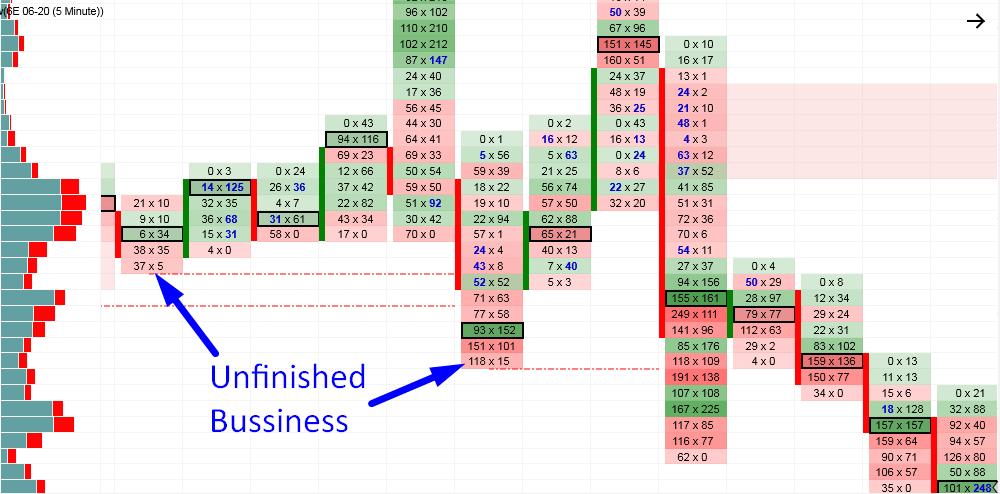
Unfinished Business
Another unique feature the TD Order Flow software is that it automatically detects Unfinished Businesses (Failed Auctions).
Unfinished Business represents market imperfection. It shows that the market went one way and when it turned the other way, the high or low was not formed properly.
What I mean by that?
Every footprint represents an Auction process. This process needs to end in a certain way. A properly formed high needs to have 0 contracts traded at the BID and a properly formed Low needs to have 0 contracts traded on ASK.
When the market turns from a new low or high without this happening, then it is called Unfinished Business (or Failed Auction).
It is an imperfection which the market has a tendency to fix. The price has a tendency to re-visit such places and “finish the business”. Essentially, you can think of these areas as a sort of magnet to the price.
My Order Flow automatically detects these areas and draws a line there. This line is drawn until the price re-visits this place again and fixes this market imperfection.
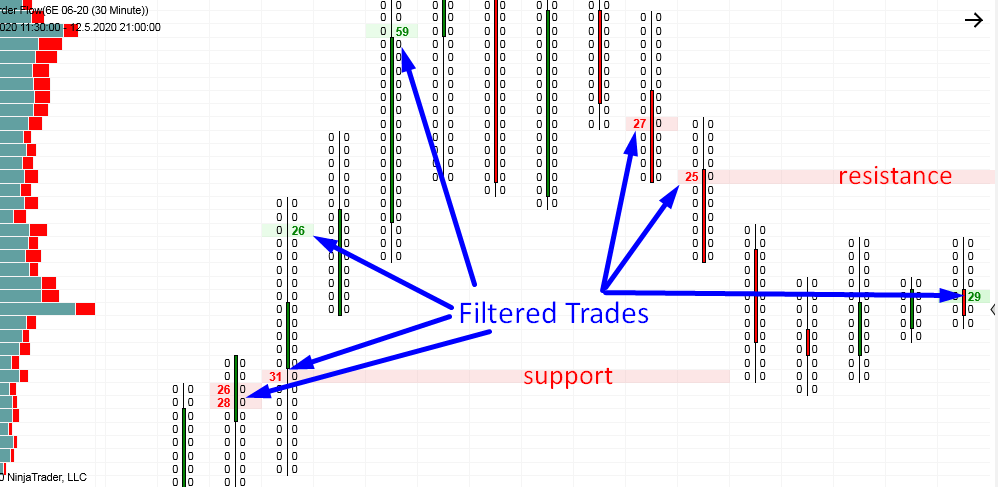
Trades Filter
This unique feature filters out all the noise from the market and leaves only the biggest trades (trades of the BIG guys we want to track).
It makes the Order Flow really easy to read and you can be sure you won’ miss any big action! When the BIG guys are present, it will show on the trades filter.
You can set the filter anyway you like – depending on how much “noise” you want to filter out. I personally prefer to set it in a way that only the biggest trading orders show.
You can build nice Order Flow entry strategy based just on the Trade Filter as taught in the Order Flow Video Course.
Cumulative Delta
This is a separate indicator which you will get as a bonus to my Order Flow software. It works so nicely with the Order Flow that it would be a shame not to use these two together!
The Cumulative Delta prints the difference between Ask and Bid. In other words – Cumulative Delta identifies the difference between the Buyers and Sellers.
If there are more aggressive Buyers jumping in, then the Cumulative Delta is rising. If there are more aggressive Sellers than Buyers then it is falling.
It is best to watch the Cumulative Delta around strong Support and Resistance zones. If strong Buyers or Sellers start to enter their trading positions there, the Delta will show you!
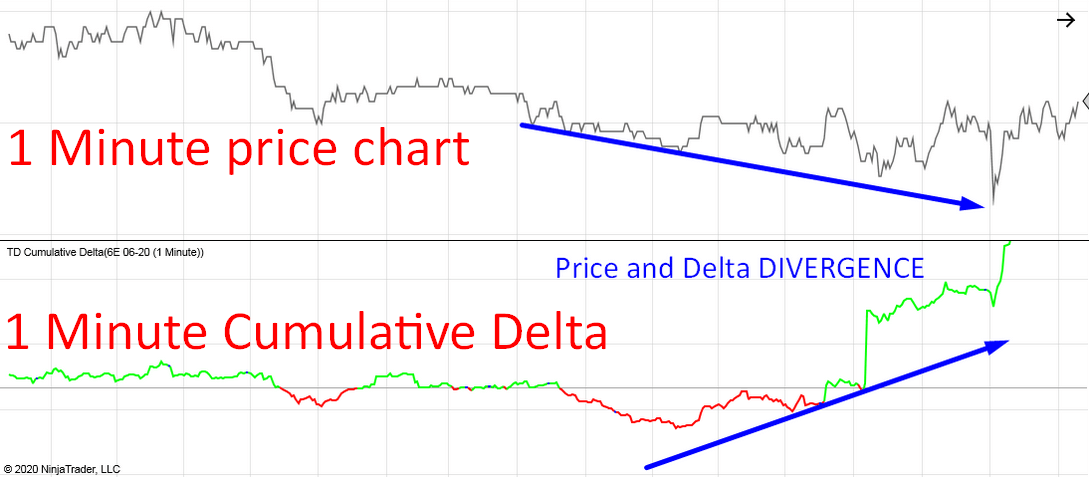
What I really like is to look for divergences between price and Delta on 1 Minute chart.
For example: The price is heading downwards, but the cumulative Delta is going upwards. This tells me that even though the price goes down, there are buyers entering their longs and that the price will most likely reverse and turn upwards.
It is best to look for Price x Delta divergences around Support and Resistance zones.
Where to get Order Flow?
TD Order Flow Software & Training – Click Here
You can get it as a part of OF Package which consists of:- Order Flow software
- Order Flow Video Course (12 hours long)
- Volume Profile Pack
This article was the second part of a four-part Beginners Guide to Order Flow. Here are links to all parts:

How is your software added to Ninjatrader 8?
When you purchase it you will get access to the downloads section and your license key. You import it to NT and use your license number to activate it.
Hi, does the free version of Ninja Trader work with this software or do you need the paid version? Thanks
Hello Taryn,
the free version will do.
Here are some pointers (Data section). The article is for Volume Profile NT7, but it is the same for OF on NT8.
https://www.trader-dale.com/q-a-volume-profile-pack-for-ninjatrader-8/