Video Transcript:
Hello
everyone, it’s Dale here. Welcome to the next video in the Recent Trade Series.
In this video, I’d like to talk about two trades I took earlier today on the ES.
I think these trades are a very good example of how important stop-loss and
take-profit placement can be in your trading and how they can determine whether
a trade will be a loser or a winner. So in this video, I’d like to focus on
showing you how to properly place stop-loss and take-profit using Volume
Profile. I will also show you an Order Flow trick to confirm a trade entry,
using the two trades I took earlier today.
All
right, let’s check it out.
What
you see before you is the NinjaTrader 8 platform, and this is the ES
chart on a 30-minute time frame. Let me first tell you what these trades were
based on. This is the 30-minute time frame, where I do my intraday analysis.
The first trade I took was based on this volume cluster that formed in a
downtrend. This volume cluster represents a place where sellers were active as
they pushed the price downward. So I went short from that volume cluster, which
means I waited for a pullback. When the price hit the beginning of the volume
cluster, I went short.
Now,
this is where I’ll show you how important it is to place a stop-loss properly.
The way I place my stop-loss is always behind a heavy volume zone like this one
and also above a recent swing point. This was the swing point above that heavy
volume zone, so this is where I placed the stop. Let me draw a straight line
here—this was the stop-loss. I’ll highlight it in red. As you can see, the
price went past my trade entry and almost hit the stop, but this whole zone is
a barrier. This entire zone acts as resistance, and you always want to place
the stop behind the barrier, which I did. I placed the stop here, behind the
barrier. By the way, the barrier is the heavy volume zone. Because of this
proper stop-loss placement, I did not get stopped out and remained in the
trade. The price returned to the trade entry, but I still held the trade until
it reached the take-profit level.
The
take-profit was just above a heavy volume zone. Let me show you—I used Volume
Profile like this and identified a heavy volume zone, which was here. This is a
heavy volume zone that could act as support because the price tends to react to
high-volume areas. When you are short, you don’t want to risk the price
reacting to support and reversing upwards, like it did here. That’s why I
exited the trade right at this point—this was my take-profit. As you can see,
it was also at the VWAP line. VWAP, by the way, is also a great place for
take-profit. This is the weekly VWAP, and it aligned with that heavy volume
zone, so this is where I took my take-profit.
The
rule to remember is this: take-profit should always be placed before a barrier,
and stop-loss should always be placed behind a barrier. Stop-loss behind the
barrier—this is the barrier. Take-profit before the barrier—this is the
barrier. That’s the main rule, and I follow it in all my trades.
Now,
let’s move on to the second trade. This was a long from this green line—this
reaction. It was based on this barrier because I saw that this barrier
presented a very nice place for a long trade entry. If you look at this zone,
you can see that there were aggressive buyers. Within this buying activity,
there was a heavy volume zone. This represents a place where buyers were
active, and the price tends to react to such levels, as it did here.
The
reason I placed the level exactly here is that there was a Fair
Value Gap. Those of you familiar with Smart Money Concepts probably see
that the Fair Value Gap is right here. My level was at the beginning of the
Fair Value Gap—that’s the place I like to trade from, the beginning of the gap.
That was the long level.
My
stop was here, below this swing point and behind the heavy volume barrier.
Again, the stop-loss goes behind the barrier. This was the barrier, so this was
the stop-loss. The take-profit was before a barrier, following the same rules.
If you look at the volume distribution here—let me move the profile a
bit—you’ll see that this heavy volume zone was a barrier. Prices often struggle
to break through heavy volume zones. This was the beginning of the barrier, and
that’s where I took my profit. As you can see, it was a good decision because
the price reacted to that barrier and moved downward. Taking the profit at this
level was the right call.
This
is how you place stop-loss and take-profit, and as you can see, both of these
trades would have been ruined if I had made a mistake with placement.
Now,
I also promised to talk about Order Flow and trade confirmation. What I want to
show you is a beautiful confirmation on the Order Flow at this level.
What
happened here was that the price was dropping toward this support level. Let me
show you what happened on the Order Flow chart when the price hit that support.
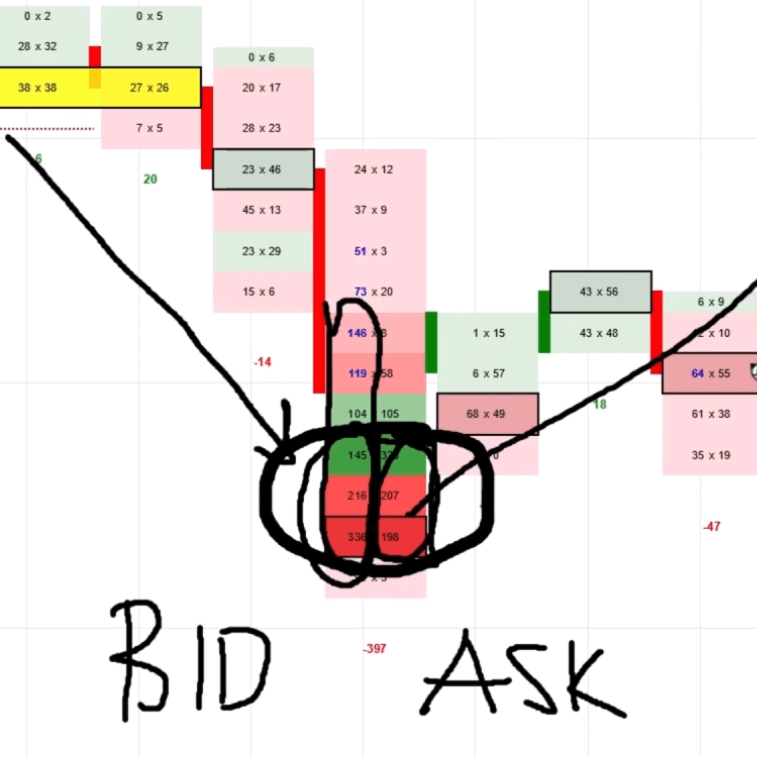
Here,
you see a 5-minute Order Flow chart. It’s a bid-ask chart. You can see how the
price was dropping toward support. This was the support level. When the price
hit the support—let me zoom in a bit—massive volumes started to appear, both on
bid and ask. Let me zoom in even more so you can see this clearly.
This
was the support level.
The
price moved toward the support, and then, in this zone, massive volumes started
appearing. There were massive volumes on both the bid (this side of the
footprint) and the ask (this side of the footprint). If you compare these
volumes to those in other areas, such as here or here, you can see that the
volumes in this area really stand out. These are unusually large volumes, which
indicate that institutional traders were active. They started entering long
positions.
I
call this specific setup the Absorption Setup because buyers are
absorbing selling pressure. This selling pressure appears on the bid as heavy
volumes from sellers. However, the price doesn’t move downward because buyers
are stepping in with massive volumes on the ask side. The price stays in place
while large buyers absorb all the selling pressure. Sellers are aggressively
selling, but buyers are absorbing everything, preventing the price from
dropping further.
This
is the confirmation you want to see at strong support or resistance levels.
This was the confirmation to enter the trade—in this case, a long.
This
is a textbook example of the Absorption Setup because the heavy volumes really
stand out. If you look at the rest of this session—the Asian session where this
trade played out—you’ll see that this is the only area with such unusually high
volume. This is no coincidence—big players were entering long positions here,
and as a result, the price reacted strongly.
These
were the two trades. By the way, I published both of these trades in the
members’ area so all members of our trading course could have traded them
alongside me.
Here
is the members’ area. This is the ES long at 5710.75—this was the
prediction I sent out yesterday. The previous level was a short on the ES at 5690
(this was using old contracts, but now we have new contracts). If I show you
the chart, this is a snippet from when I made that prediction. This chart is
the ES, showing both the short and long trade levels.
If
you’re interested in joining us and trading live every day in our trading room,
I recommend visiting my website, Trader-Dale.com.
Click the FTA
button (Funded Trader Academy), and it will take you to a page where you can
book a one-on-one call with us. We’ll walk you through the service, show you
around, and help you decide whether the live trading room is right for you.
If
you prefer self-study rather than a live trading room, visit the Trading
Course and Tools page, where you can browse my educational materials
and indicators focusing on Volume Profile, Order Flow, and VWAP.
That’s
it for today’s video! I hope you found it useful. I’ll see you next time. Until
then, happy trading!