
Do you want ME to help YOU with your trading?
Video Transcript:
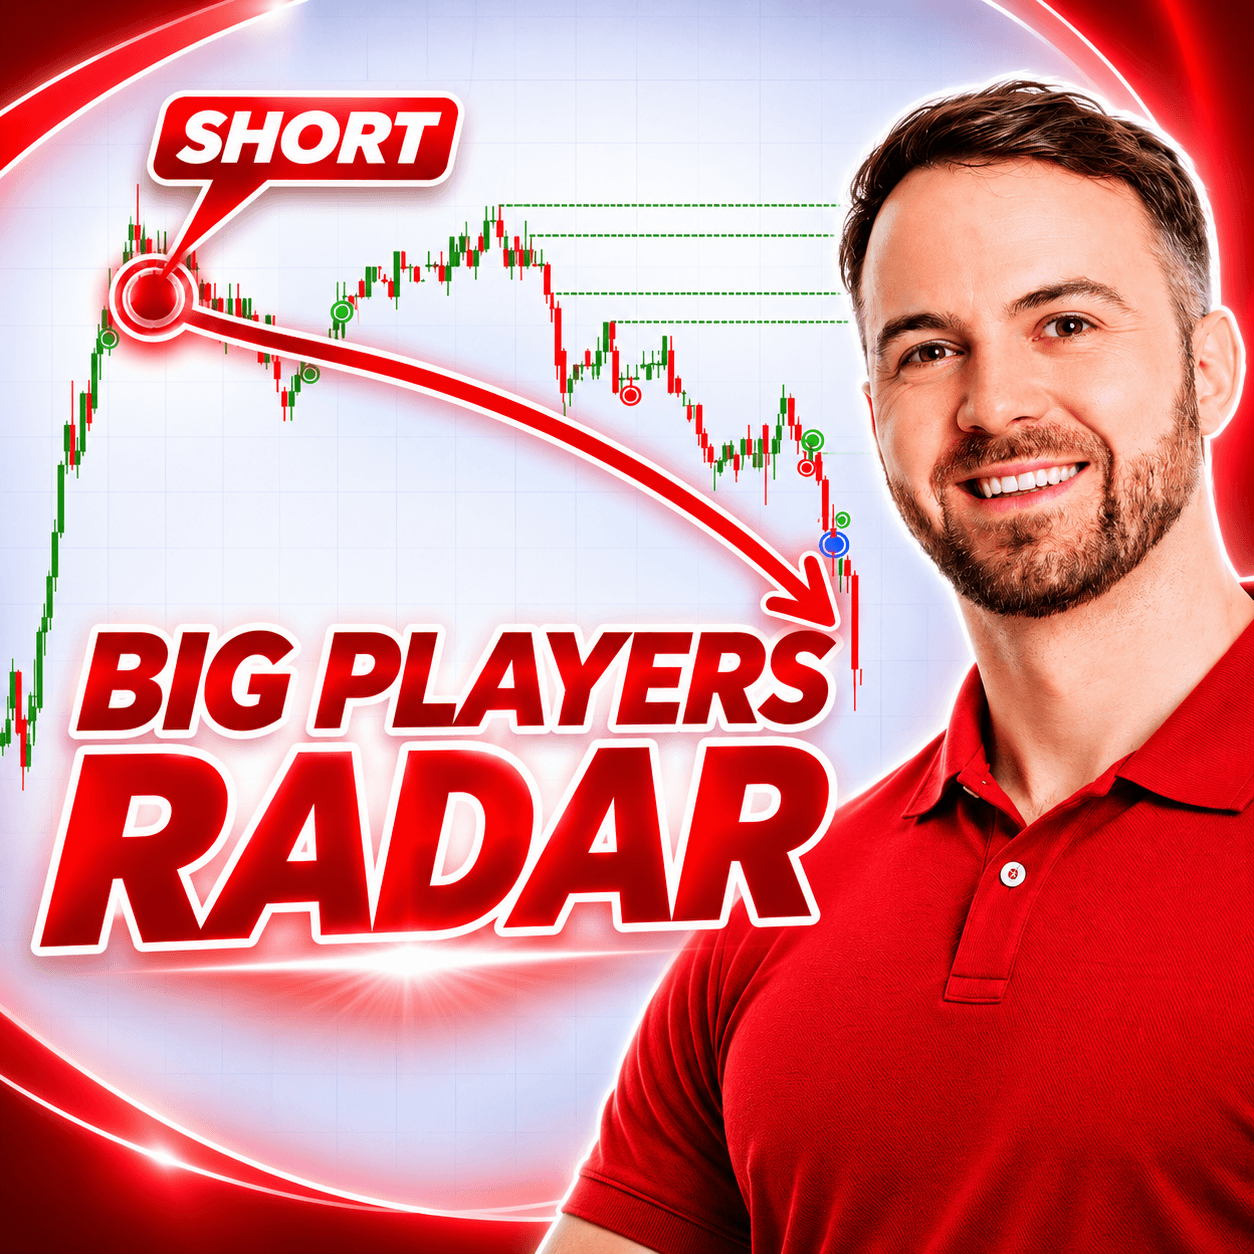
Hey guys, in this video, I want to show you a complete trade walkthrough using my new indicator for TradingView, which is based on Order Flow and is called Big Players Radar. This indicator brings out the best of Order Flow and is able to show it to you on a simple price action chart, and this is what I’m going to show you now. So, what you see here is the TradingView platform, and you’re looking at a trade that I took yesterday on the British pound. So, this is a 5-minute chart on the British pound futures, and let me first walk you through the reasoning behind the level that I was looking to trade with the Big Players Radar, okay? So, the reasoning behind the trade goes like this. First, I use my Volume Profile to identify a heavy volume zone, this one, from which a strong sell-off started, right? This heavy volume zone represents a place where sellers were accumulating their short positions before pushing the price downwards. This is a Volume Profile setup that I call the volume accumulation setup because the sellers were accumulating their shorts in here. What I did next was place this red line on my chart, and it represented a potential resistance because I thought that if the market returned to that place where those heavy volumes started, those strong sellers who were present there might want to trade this again and push the price downwards from there because they’re likely to defend this place, which was important for them in the past. So, this was the logic behind this resistance, but I wanted to see confirmation when the price actually hit this resistance, and this is where the Big Players Radar comes into play. What this indicator does is spot where the big players join the party, and you can see that here. Those two red targets are big players, big traders. The indicator is able to identify them as big traders because it can detect when unusually heavy volumes are traded there. It’s not just a threshold above which the indicator would tell you that we are looking at big players. Instead, it’s able to look into history, compare the same times of the day on the same instrument, and determine what normal volume is and what unusual volume is. If the volume is unusual, then the software marks it as a big player stepping in. And that happened in here. Those two red targets represent two massive orders. They are red because those were orders placed at the bid. That means most likely those were aggressive sellers, strong aggressive sellers joining the party here. When I saw that, I considered it confirmation of this resistance, and I went short from there. That’s the trade entry.
Now, it is not just about entering the trade, but it’s also about managing it. So, let’s talk about stop-loss and take-profit. For that, I use Volume Profile. So, let’s first talk about the stop-loss placement. Rule number one, the most important rule for stop-loss placement, is that it always needs to go behind a barrier. The barrier in most cases is a heavy volume zone. So, this was the heavy volume zone that the trade was based on. That was the barrier, this whole zone. And that barrier should protect your trade, and you should place your stop behind it. So, this is where I placed the stop. Now, as far as the take-profit is concerned, the rule that I follow for take-profit placement is that it should go before the first barrier standing in the way. So, let me show you. I used the Volume Profile here, and I looked into this area as the price was dropping towards it. And I identified this heavy volume zone. That was a barrier, the first barrier standing in the way. That’s why I quit the trade there before the price had the chance to fully hit the barrier. So, I quit the trade in here because this whole zone is a heavy volume barrier, and there is a chance that the price will react to it like this. Okay, so that’s why you want to quit the trade before it reaches the barrier, so you don’t risk your trade.
Black Friday pricing on the Volume Profile pack and the other 3 indicator packs. Ends Nov 30.
So, this is how I trade. Those are my rules for intraday trading. This is how I implement Big Players Radar into my trading. It’s very handy, especially for those who don’t want to learn how to trade with Order Flow and just want to take the best stuff out of Order Flow, find the big players joining the party, and confirm their trades on simple candlestick charts. So, this is how the trade went. I hope you guys liked the video. I hope you found it useful.
If you want to get your hands on this indicator, then all the members of our trading course get this for free. If you’re not a member, you can join us on my website, which is trader-dale.com. If you click the button that says “Trading Course and Tools” then you can join us there and get your hands on this indicator, as well as my complete trading courses, where I’ll teach you everything that I do, from A to Z, every day. All right, so thanks for watching the video, and I’ll be looking forward to seeing you next time. Until then, happy trading.
Black Friday pricing on the Volume Profile pack and the other 3 indicator packs. Ends Nov 30.