
What if your chart could tell you when big traders step in? Not guess. Not hope. Actually show you. That is the job of the Big Players Radar indicator, a new TradingView tool I built for Order Flow traders. In this article, I’ll show you how to use it on a real trade I took on the NQ.
Here is the thing most traders miss. An indicator on its own is not a strategy. Big player activity only matters when it appears at a strong support or resistance zone. So we will start where every good trade starts: finding the level. I’ll use Volume Profile and a Fair Value Gap to do that.
Then we will zoom in. You’ll see how the radar marks unusually heavy volume right inside the footprint. You’ll learn what the blue dots mean, what the green bubbles mean, and how to spot a bear trap. I have traded futures with Volume Profile and Order Flow for years. This is the routine I follow every day.
By the end, you will know exactly what to look for and when to act. You’ll also know when to ignore a signal completely. That last part may save you more money than anything else in this guide.
Open your TradingView chart, and let’s walk through this NQ trade together.
Table of Contents
What Is the Big Players Radar Indicator?
A Simple Explanation
The Big Players Radar indicator is a TradingView tool that works on top of your Order Flow footprint. It has one main job. It finds places where unusually heavy volume was traded and marks them on your chart.
Why does that matter? Because big traders, like banks and funds, trade large size. When they step in, volume jumps far above normal. If you can spot that jump, you can see where the big players are acting.
How It Decides What Is “Unusual”
This is the tricky part, and it is where most tools fall short. Is a volume unusual compared with today’s session? Or compared with last week? Volume changes a lot during the day. The market open is always busy. Lunch hours are usually quiet. So a simple average can fool you.
The radar solves this problem in a smart way. It looks far back in history and compares volume with the same time of day in past sessions. If the current volume is way above normal for that time, it gets marked. That gives you a fair, honest comparison.
Here is a simple example. Imagine 2,000 contracts trade at one price during the busy open. That might be normal. Now imagine the same 2,000 contracts trade during a quiet lunch hour. That is unusual, and it likely means a big player is active. The radar understands this difference, so you don’t have to work it out in your head.
What the Signals Mean
Marker | What It Shows | What It Means |
Blue dot | Heavy volume at the bid and the ask | Absorption |
Green bubble | Heavy volume at the ask | Aggressive buyers |
Trap mark below footprint | Traders stuck at an extreme | Trapped buyers or sellers |
Keep this table handy. We will see each of these signals in the NQ trade below.
How Do You Find a Strong Level Before Using Big Players Radar?
Start on the 30 Minute Chart
Before I even look at the radar, I need a level. The radar tells me when big players act. The level tells me where I should care.
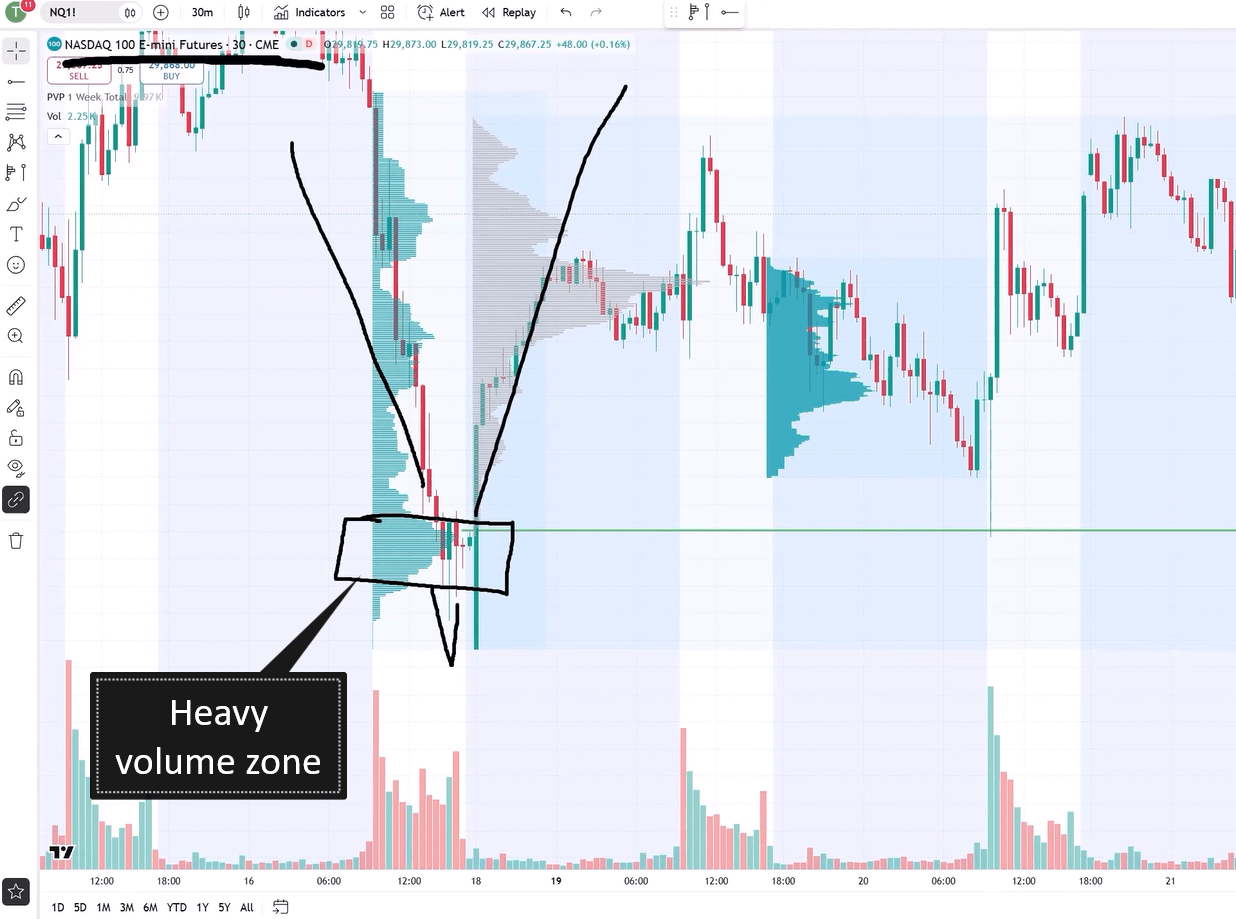
For this trade, I opened a 30 minute chart of the NQ, the Nasdaq 100 futures contract. I spotted a strong rejection of lower prices. Price dropped, then turned up sharply. From there, a whole uptrend started.
Look for a Heavy Volume Zone
Inside that rejection, a heavy volume zone formed. I found it using Volume Profile. This zone shows where buyers stepped in with real size. They turned the market around, and the uptrend began from there.
Those buyers matter. When price comes back to their zone, they often defend their positions. That is why the zone can act as support on a pullback.
I placed my support roughly at the beginning of the heavy volume zone. In a bullish setup like this, the start of the zone is the first place buyers are likely to defend. Waiting deeper inside the zone often means missing the reaction completely.
Add a Fair Value Gap for Confluence
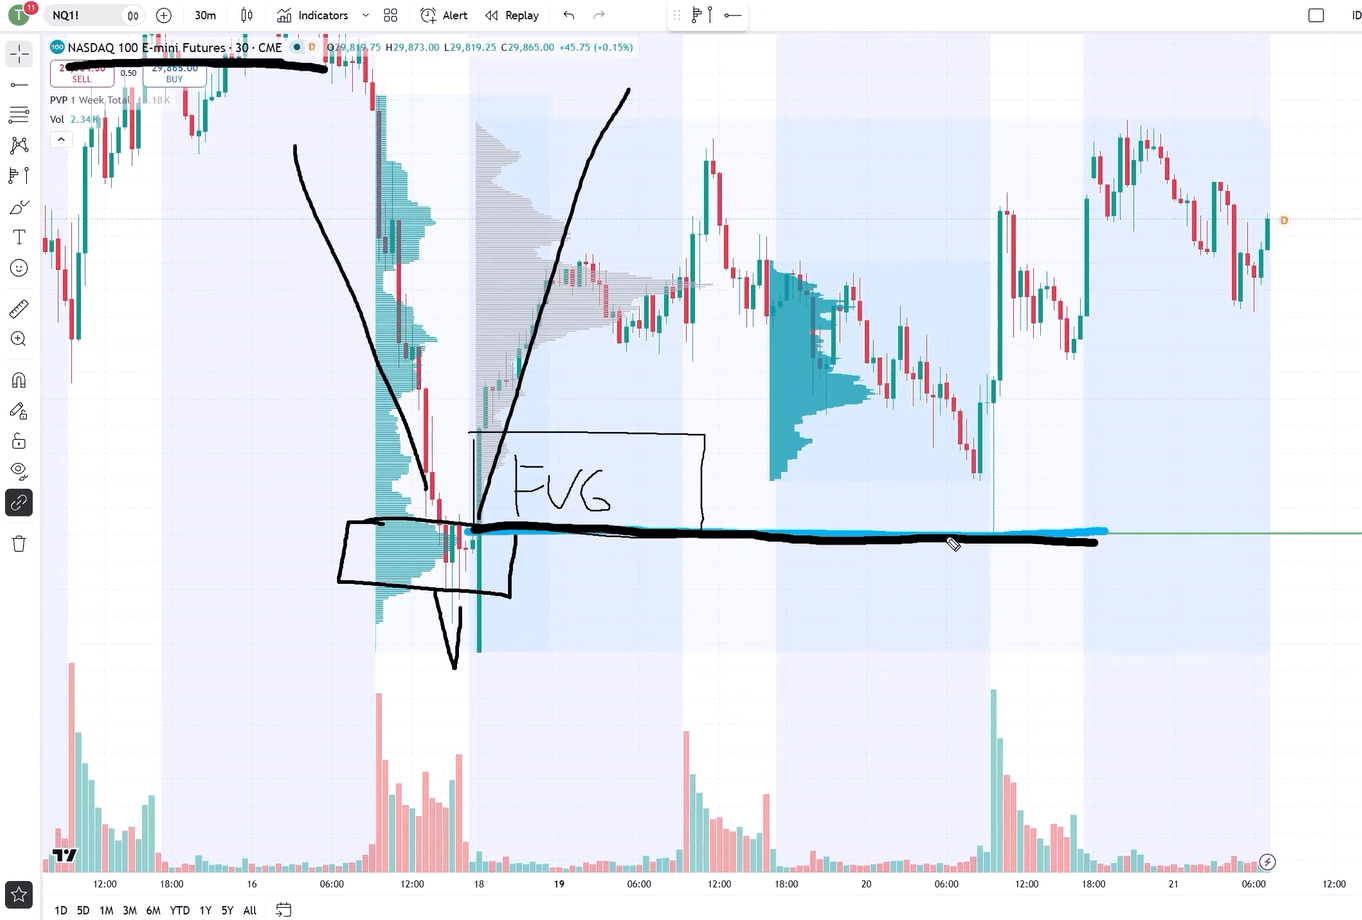
There was one more clue. The same price was also the start of a bullish Fair Value Gap. A Fair Value Gap is a fast move that leaves a gap between candle wicks. A bullish gap begins at its lower edge, and that edge lined up with my heavy volume zone.
So my support sat at 29,400. Two tools pointed to the same price. That is called confluence, and it makes a level stronger.
Now I had my plan. I would wait for a pullback to 29,400. If price got there, I wanted to see big players step in before I took the trade.
How Does Absorption Show Up on the Big Players Radar Indicator?
Switch to the 5 Minute Order Flow Chart
Once the level was ready, I moved to a 5 minute chart with my Order Flow layout. The green line on the chart was my support at 29,400.
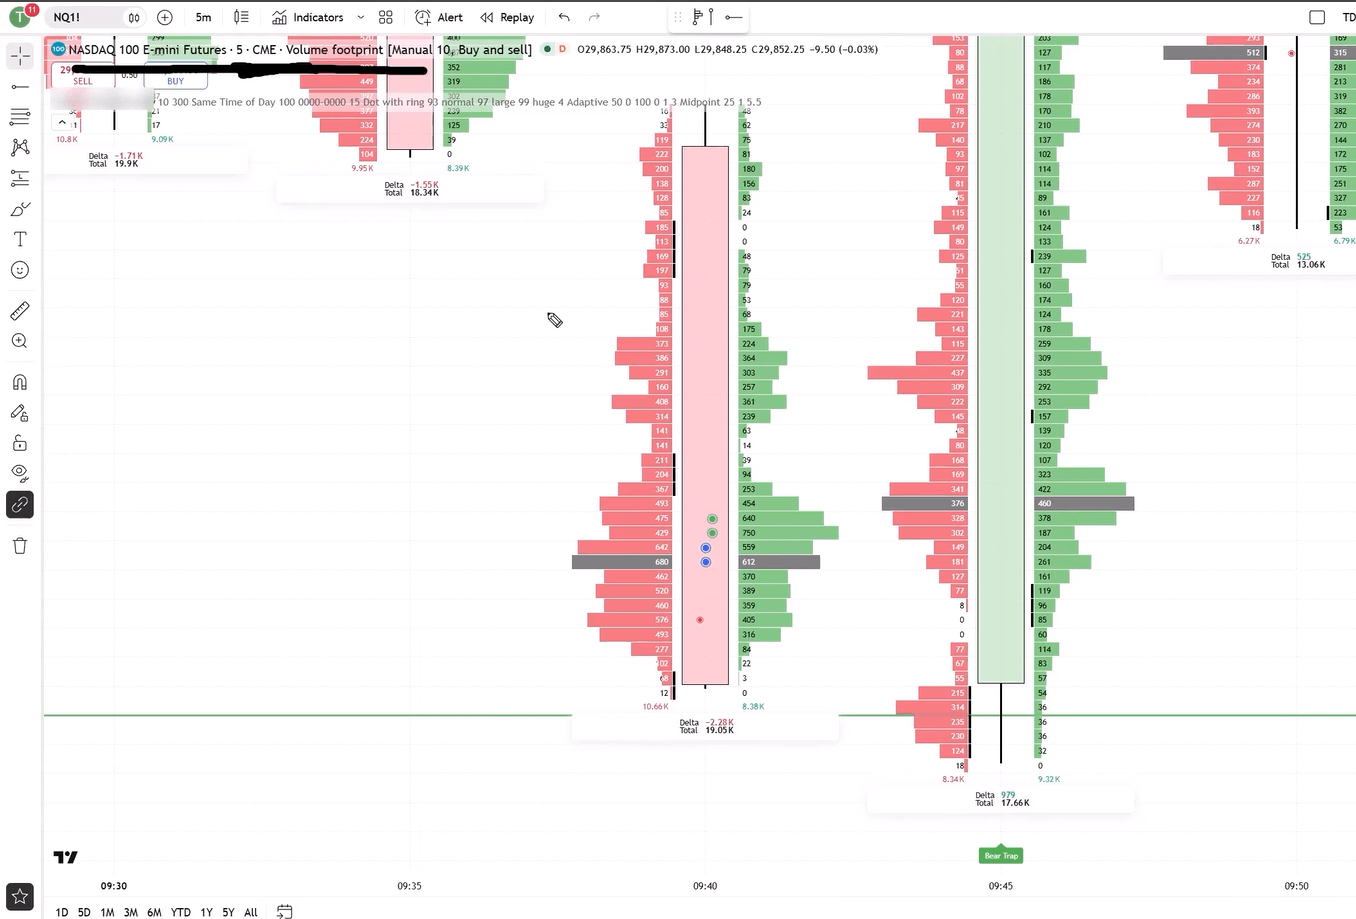
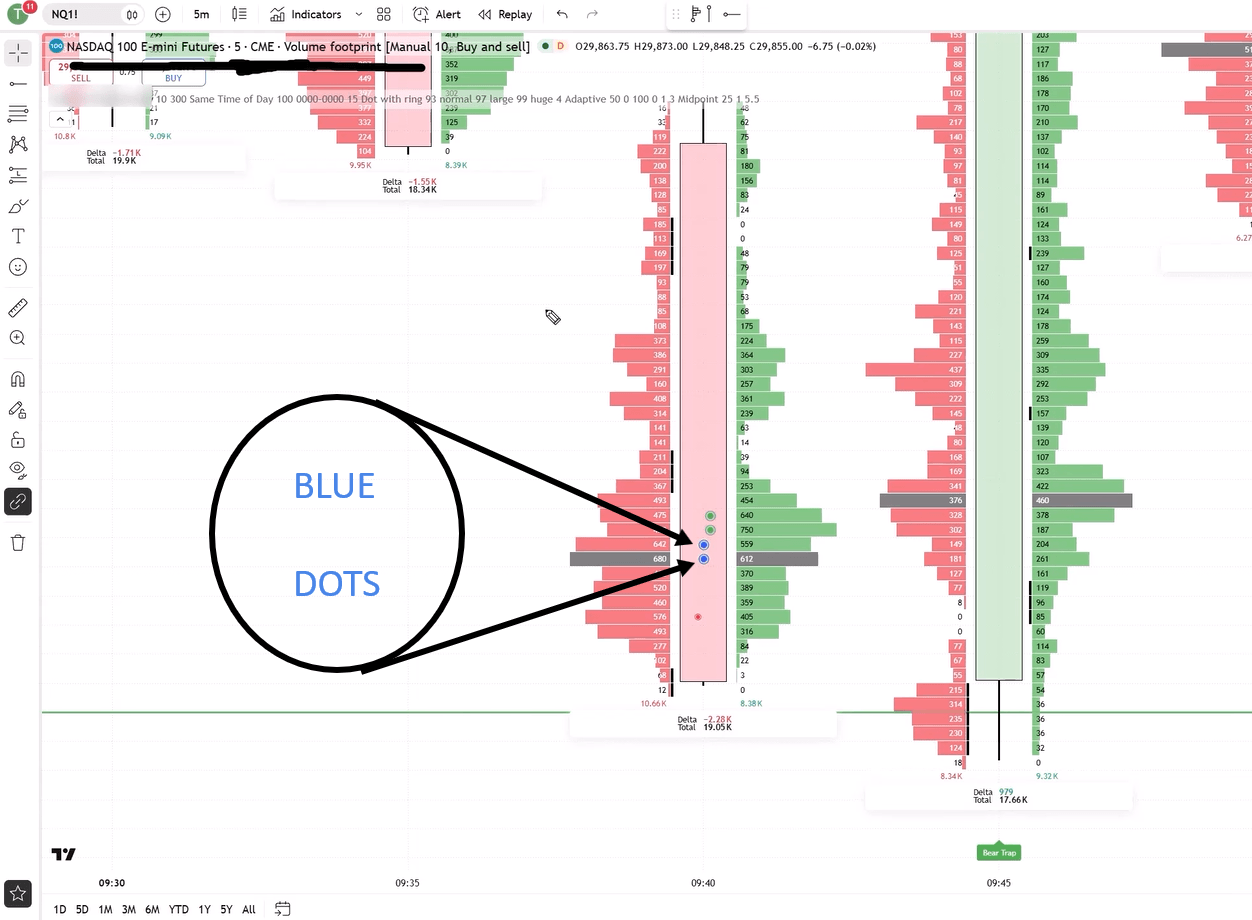
Price started dropping toward that line. Then something interesting appeared on the Big Players Radar indicator: a few dots. The most important ones were two blue dots.
What the Two Blue Dots Meant
A blue dot means unusually heavy volume at both the bid and the ask. In this footprint, two cells were marked on the bid side and two on the ask side.
Let’s break that down simply:
- Heavy volume at the bid shows aggressive sellers hitting the market.
- Heavy volume at the ask shows buyers buying just as hard at the same prices.
Sellers kept selling, but buyers took everything they offered. That is absorption. Buyers soaked up the selling pressure, and big players were behind it.
Is Absorption Enough to Enter?
Yes. Absorption with unusually heavy volume is enough to enter the trade. It shows that big players see the support and want to buy there. They are positioning for the move up.
One detail is worth noting. This absorption appeared a little above my support, not exactly on it. That is fine. It was still within a reasonable range of the level. Markets are not perfectly precise, so allow a small buffer around your zone.
Why does price sometimes react early? Big players don’t always wait for the exact tick you drew. They see the same zone, and some of them start buying as price gets close. If you insist on a perfect touch, you may watch the trade leave without you. A few points of tolerance keeps you in the game without chasing.
What Do the Green Bubbles Tell You About Aggressive Buyers?
Aggressive Buyers With Real Size
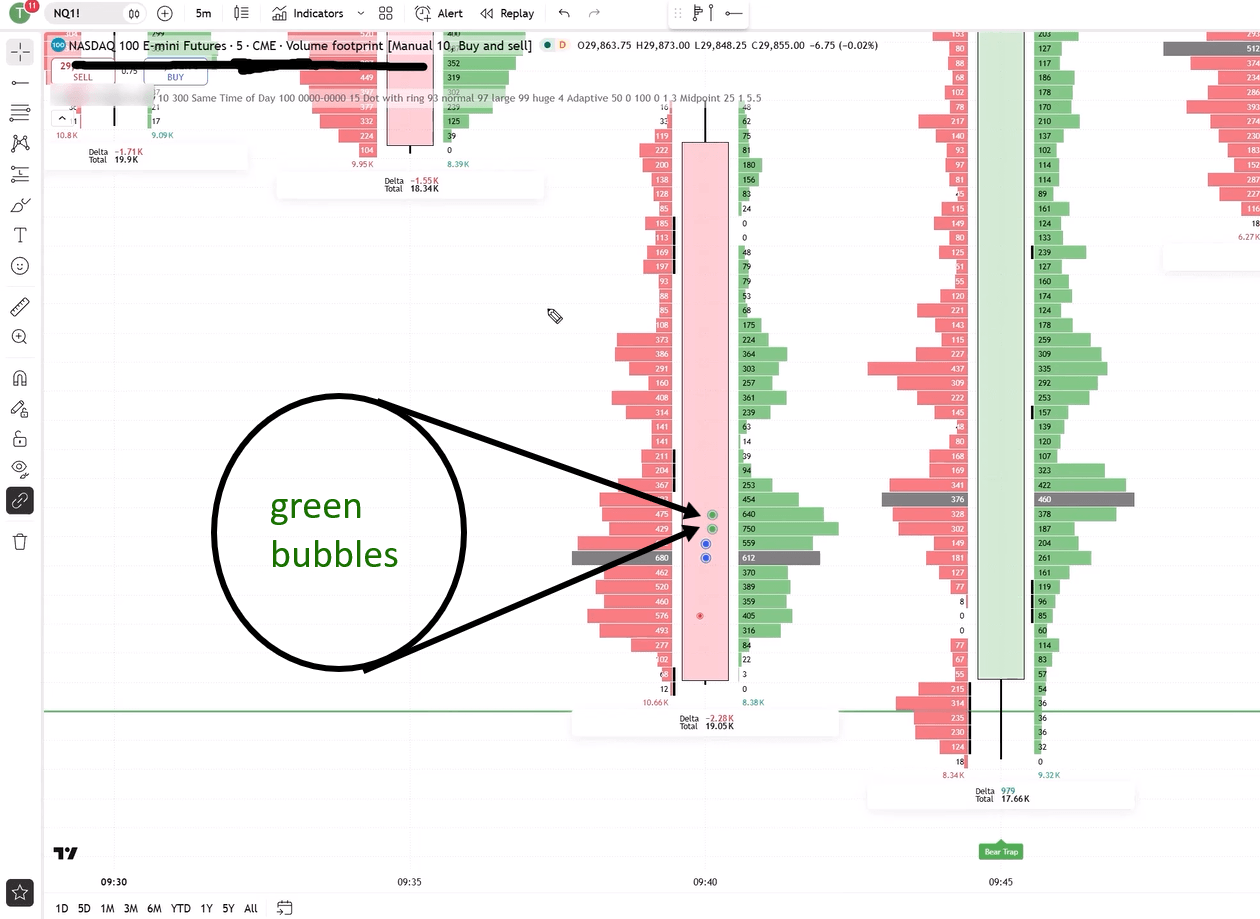
Next, the radar printed two green bubbles. Green means unusually heavy volume at the ask.
When a trader buys at the ask, they are not waiting for a better price. They want in right now. That is an aggressive buyer. Plenty of small traders do this every minute, though. What makes this signal special is the size. These were aggressive buyers trading unusually heavy volume for that time of day.
Why This Is a Second Confirmation
The software checks these bubbles the same way it checks absorption. It compares the volume with the same time of day in past sessions. So when a green bubble appears, you know the buying was far above normal.
That gave me a second confirmation. First, big players absorbed the selling. Then, big players started buying aggressively. Both signals pointed up. When absorption and aggressive buying appear together at a strong level, the picture becomes very clear.
Signal | What I Saw | Why It Matters |
Absorption | Two blue dots | Big buyers soaked up selling |
Aggressive buying | Two green bubbles | Big buyers pushed price up |
That Is All You Need
Honestly, this is everything you need to confirm the entry. You have a strong level. Absorption is there. Aggressive buyers with heavy volume are there too. When those line up, the buyers are clearly stepping in, and you have a solid reason to go long.
Don’t overcomplicate it. More indicators will not make this setup better. Clear signals at a clear level are what you want.
Adding more tools often creates more doubt, not more confidence. One indicator says buy, another says wait, and you freeze. Keep your chart clean. Volume Profile gives you the level, and the radar shows you the big players. Those two pieces work together and cover what this setup needs.
What Is a Bear Trap Signal and When Can You Use It?
How the Radar Shows Trapped Traders
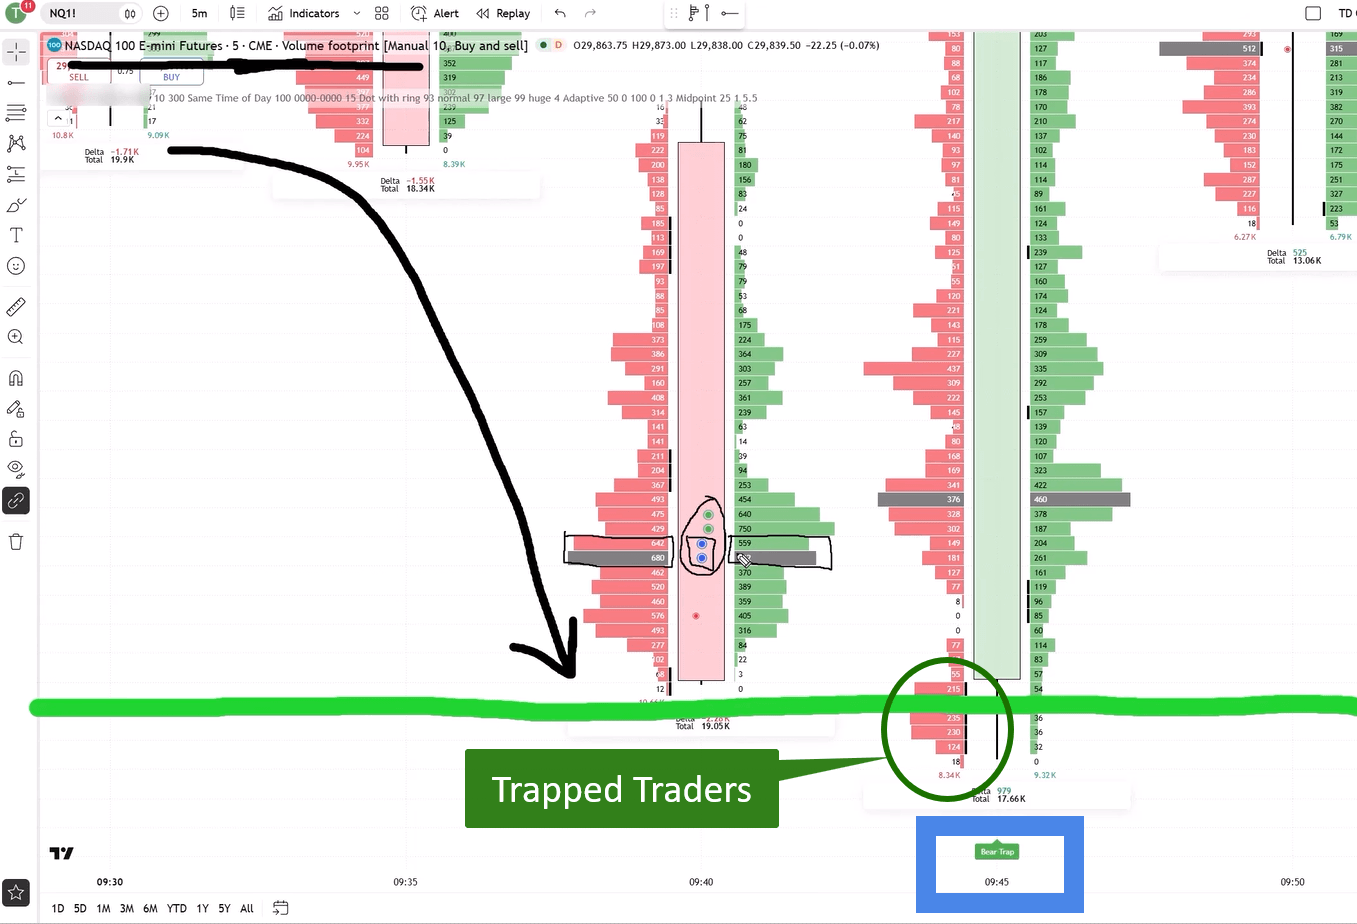
There is one more signal worth knowing. The Big Players Radar also prints a mark below each footprint where traders got trapped. It can show trapped buyers or trapped sellers.
In this NQ trade, it showed trapped sellers. You could see selling imbalances at the very bottom of the candle. Those sellers jumped in late, near the low. Then buyers took over and pushed price up. The sellers were stuck in losing positions.
This setup is called a bear trap. Trapped sellers often need to buy back their positions to get out. That extra buying can push price even higher.
The Timing Problem
So when can you actually spot a bear trap? Only after the candle closes. Until then, you cannot be sure those sellers are really trapped.
In this trade, that was a problem. The reaction from support was very fast. By the time the candle closed and the trap was confirmed, price had already moved up a lot. Waiting for it would have meant a late entry.
How to Use It Wisely
Think of the bear trap as a bonus signal, not your main trigger. In this trade, absorption and aggressive buying had already confirmed the entry. The trap simply added more proof that buyers were in control.
In slower markets, a bear trap can still be a useful entry signal. In fast markets, use it to support a trade you already have.
The same logic works in reverse at resistance. There, the radar can flag trapped buyers who bought near the top just before sellers took over. That is called a bull trap, and it points to a possible move down. Learn to read both versions, and the signal becomes useful in any market direction.
Why Does Context Matter When Using the Big Players Radar Indicator?
Signals Without a Level Mean Little
This is the most important lesson in the whole article. Big player signals can appear anywhere on the chart. On their own, they don’t mean much.
Why? Because big traders are active all day. They hedge, adjust positions and fill large orders. Not every heavy volume print is a turning point. Some of it is simply routine business with no message for you. If you trade every dot you see, you will take a lot of random trades.
Level First, Then Radar
So here is the rule. First, find a strong support or resistance zone with Volume Profile. Then watch for big player activity at that zone with the radar. When both appear together, the signal has real meaning.
That’s exactly what happened in this trade. The level at 29,400 came first. The blue dots and green bubbles came next. Bingo! That’s where you join the party and enter the trade.
A Simple Checklist
Before you act on any radar signal, run through these four checks:
- Is price at a strong level I marked in advance?
- Did the radar show absorption with blue dots?
- Did aggressive buyers show up with green bubbles?
- Is the signal within a small range of my level?
Answer yes to the first question and at least one of the next two. Then you have a valid setup. If price is nowhere near your level, ignore the signal and wait.
Patience is a skill, and this checklist helps you build it. Some days the radar will light up all over the chart while price stays far from your zones. That’s fine. Your job is not to trade every signal. Your job is to trade the right signal at the right place.
FAQ
Does the Big Players Radar indicator work on markets other than NQ?
Yes. It compares volume with the same time of day for each instrument. That lets it adapt to any market with reliable volume data, including ES.
Can I enter on absorption alone?
Yes, if it appears at a strong level. In this trade, absorption with unusually heavy volume was enough to justify the entry.
Should I wait for the bear trap signal?
Usually not. It only confirms after the candle closes. Treat it as extra proof rather than your main entry trigger.
Conclusion
Let’s recap what you learned from this NQ trade. The Big Players Radar indicator shows you where unusually heavy volume was traded. It compares volume with the same time of day in past sessions. That makes the signals fair and easy to trust.
But the radar never works alone. First, I found a level on the 30 minute chart. A strong rejection of lower prices created a heavy volume zone. A bullish Fair Value Gap started at the same price, so my support sat at 29,400.
Then I switched to the 5 minute Order Flow chart. As price dropped toward support, the radar printed two blue dots. That showed absorption, with big buyers soaking up the selling. Soon after, two green bubbles showed aggressive buyers trading heavy volume. Those two signals were all I needed to enter.
The radar also flagged a bear trap with trapped sellers. It arrived a bit late because the candle had to close first. Still, it added more proof that buyers were in control.
Remember the main lesson. Signals mean little without context. Find your level first, then let the radar show you when big players step in. Keep your chart clean, follow your checklist and stay patient.
Ready to Learn the Full Strategy? Want to learn how I combine Volume Profile, Order Flow and the Big Players Radar from A to Z? Visit Trader-Dale.com and click “Trading Course and Tools.” Members get access to Big Players Radar along with my complete trading strategy. Apply my coupon code KEVIN10 at checkout for an extra 10% discount. |