Prefer an article? Go here: How to Use Fair Value Gaps in Trading: A Complete Strategy Guide
Fair value gaps have become one of the most talked about concepts in trading circles. You will find them on almost every chart if you know what to look for. But here is the honest truth: many traders spot them, trade them blindly, and lose money doing it. The reason is that not all fair value gaps are created equal, and trading without knowing how to tell a strong one from a weak one puts you at a real disadvantage.
This article is a step by step guide to understanding what fair value gaps actually represent, how to identify them correctly, and most importantly, how to build a simple and repeatable strategy around them. You will learn what separates a high quality fair value gap from one that is better left alone. You will also see how combining them with Volume Profile can give you a stronger edge. By the time you finish reading, you will have a clear, structured approach to adding fair value gaps to your trading.
Table of Contents
5 Key Points
- A fair value gap shows that one side of the market (buyers or sellers) was more aggressive than the other.
- Every fair value gap is made up of three candles. The gap forms between the high of the first candle and the low of the third candle (for bullish gaps), or the low of the first candle and the high of the third candle (for bearish gaps).
- The strongest level to trade from is the beginning of the fair value gap, which is the high of candle one in a bullish gap or the low of candle one in a bearish gap.
- Not all fair value gaps are worth trading. The best ones are large, stacked, and aligned with a volume cluster.
- You can find a free and reliable fair value gap indicator on TradingView by searching “FVG.”
What Is a Fair Value Gap?
A fair value gap is a zone on a price chart where buying or selling pressure was so strong that the market moved quickly through that area without properly filling both sides of the order book. In plain terms, it is a sign that one side of the market was being more aggressive than the other at that moment.
Bearish Fair Value Gaps
When you look at a chart and see a downtrend, you might notice certain candles that move sharply lower with very little overlap between them. Those sharp, uninterrupted moves often leave behind what is called a bearish fair value gap. A bearish fair value gap tells you that sellers were in control and were pushing price downward quickly, creating an imbalance. The highlighted area in red on the chart is where that imbalance lives.

Bullish Fair Value Gaps
On the other side, a bullish fair value gap forms when buyers are the aggressive force. Price shoots upward in a way that creates a gap between price levels. The highlighted area in green marks where that aggressive buying happened. Price often returns to these zones later because the market has a tendency to come back and fill the imbalance that was left behind.
Why the Market Returns to These Zones
The concept is rooted in how markets work. When price moves too fast in one direction, there are unfilled orders and untested price levels left in that zone. Larger players in the market, often institutions, may use those zones as reference points when they look for opportunities to enter or exit trades.
Understanding this idea is the foundation of the entire fair value gap strategy. It is not just about identifying a gap on a chart. It is about understanding the story that gap is telling you about who was in control of the market at that point and why price might revisit that area again.
How to Identify a Fair Value Gap on Any Chart
Now that you know what a fair value gap represents, the next step is learning how to spot one. The good news is that the rule is very simple and works the same way whether you are looking at a bullish or bearish gap.
Every fair value gap is made up of exactly three candles. That is candle one, candle two, and candle three. The gap itself is found between the first and third candles. Here is how it works for each type.
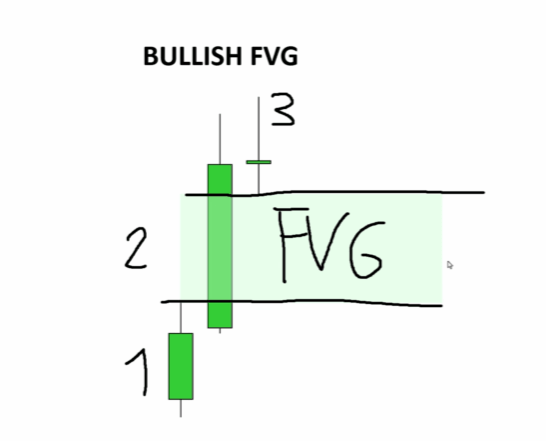
The Bullish Fair Value Gap Rule
Look at three consecutive candles where price is moving upward. For a bullish fair value gap to exist, the high of candle one must not overlap with the low of candle three. In other words, there is a gap between those two levels. The candle in the middle (candle two) is the one that made the big move. The space between the high of candle one and the low of candle three is your fair value gap zone.
It does not matter whether candle one or candle three is a bullish or bearish candle individually. The only thing that matters is whether that gap exists between their key levels.
The Bearish Fair Value Gap Rule
For a bearish fair value gap, you are looking at three candles where price is moving downward. The low of candle one must not overlap with the high of candle three. If there is a clear gap between those two levels, you have a bearish fair value gap. Again, the individual candle direction for candles one and three does not matter.
Below is a simple comparison table to help you remember the rule:
Gap Type | Key Rule | What It Signals |
Bullish Fair Value Gap | High of candle 1 does not touch low of candle 3 | Aggressive buyers created an imbalance |
Bearish Fair Value Gap | Low of candle 1 does not touch high of candle 3 | Aggressive sellers created an imbalance |
Once you train your eye to look for this three candle structure, you will start seeing fair value gaps everywhere. In fact, most active charts on any timeframe have multiple gaps at any given time. The real skill, which is what the rest of this article covers, is learning which ones are actually worth your attention.
The Strongest Level Inside Every Fair Value Gap
Once you have identified a fair value gap, the next question is: where exactly do you look to trade from within that zone? This is where many traders get confused, because the gap covers a range of prices and it is not always clear which specific level to focus on.
The answer is the beginning of the fair value gap. That is the level with the most significance, and it is the one that offers the cleanest entry when price pulls back into the zone.
Trading the Bullish Fair Value Gap Entry

The beginning of the gap is the high of candle one. When price makes a pullback and returns to that level after the initial move upward, that is where you look to go long. The logic is straightforward: that level was the last point before the aggressive buying started. It acts as a kind of floor that buyers are likely to defend when price revisits it.
So the process looks like this. Price moves up aggressively through the gap zone, then later pulls back down toward the gap. When it reaches the high of candle one, that is your area of interest for a long entry.
Trading the Bearish Fair Value Gap Entry
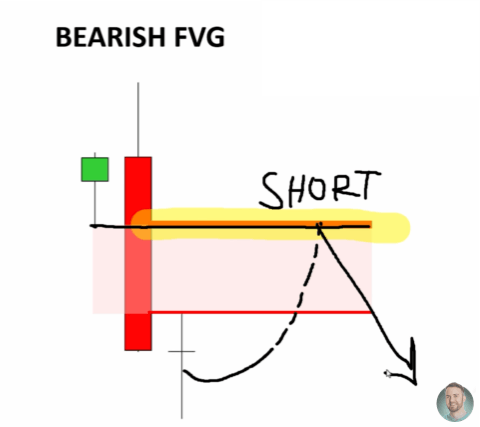
The beginning of a bearish fair value gap is the low of candle one. After price sells off through the gap zone, if it later retraces upward and reaches that level, that low acts as a ceiling or resistance. That is where you would look to go short.
Think of it this way: if price was rejected from a level on the way down so hard that it left a gap, there is a good reason to think the market respects that same level when it comes back up to test it.
What Happens When Price Does Not Reach the Level
It is worth noting that sometimes price does not reach the exact level. It might react just before touching it. When that happens, the level is considered to have been tested, and you would not look to trade it again on a second approach. Once a level has served its purpose, it loses its value as a trade location.
What Makes a Good Fair Value Gap (and What to Avoid)
Here is where things get practical. At any given time on almost any chart, you can find dozens of fair value gaps. If you tried to trade every single one, you would exhaust yourself and your account. The real edge in this strategy comes from being selective and choosing only the gaps with the highest probability of working out.
There are three main factors that separate a strong fair value gap from a weak one: size, stacking, and confluence. This section covers the first factor, and the following sections cover stacking and confluence in detail.
Why Size Is the First Quality Filter
The general rule is simple: the bigger the fair value gap, the better. A large gap means that the move that created it was powerful. It means that one side of the market was significantly more aggressive than the other. A wide gap zone is a stronger signal of market imbalance than a narrow one.
When you see a massive single candle that creates a large fair value gap, that tells you something very clear about market sentiment at that moment. Compare that to a tiny gap that is barely visible. The tiny gap could have been created by any minor fluctuation. The large one is much harder to ignore from a market perspective.
Fair Value Gaps Formed During News Events
Many newer traders wonder whether a fair value gap that formed during a major news event, such as a central bank announcement or an employment report, should be treated differently. The short answer is no. A gap formed during a macro news event is still a valid fair value gap. In fact, news events often produce the largest, cleanest gaps because the move is decisive and fast. Those are worth paying attention to.
The takeaway here is to look for gaps that stand out visually. If you have to squint to see the gap zone, it probably is not the one to trade.

How to Stack Fair Value Gaps for Better Entries
Stacking is the second quality factor, and it is one of the most powerful concepts in this entire strategy. When you see multiple fair value gaps that are clustered closely together in the same area, you treat the entire cluster as one large combined zone rather than several small separate ones.
Why Stacked Gaps Carry More Weight
The reason this matters is simple. If the market created one fair value gap in a certain area, that is meaningful. If it created two or three gaps in very close proximity, that area is telling you something much louder. Multiple gaps in the same zone mean that the market returned to that area more than once and continued to create imbalance in the same direction. That level of repetition adds weight to the zone.
When gaps are stacked, the most important level is still the beginning of the first fair value gap in the cluster. That is your primary reference point for entries. You do not need to try to pick individual levels within the stack. The zone as a whole is what matters, and the entry anchor remains at the top of the first gap (for a bullish stack) or the bottom of the first gap (for a bearish stack).
How to Recognize a Stacked Setup
Look for two or three consecutive bursts of momentum in the same direction, each one leaving a gap on the chart. If those gaps are close enough together that they appear to form one continuous zone without large amounts of price action separating them, you have a stacked setup.
Stacking also helps you filter out noise. A single small gap in isolation is not very convincing. But several small gaps stacked together can add up to a meaningful zone, especially when the other quality factors are also present.

How to Combine Fair Value Gaps with Volume Profile
The third quality factor is confluence, and nothing provides stronger confluence for a fair value gap than Volume Profile. If you are not familiar with Volume Profile, it is a tool that shows you how much trading volume occurred at each price level over a specific time period. The result is a horizontal bar chart sitting alongside your price chart, with taller bars indicating levels where a lot of trading activity took place.
What Volume Clusters Tell You
Those high volume areas, often called volume clusters or high volume nodes, are levels where large market participants were heavily active. Institutions, large traders, and market makers tend to do significant business at these levels. Because of this, these levels often act as support or resistance when price returns to them in the future.

How the Combination Works
Now imagine you have a fair value gap sitting right on top of a major volume cluster. You have two separate, independent reasons why that price level should be significant. The fair value gap tells you that the market left an imbalance there. The volume cluster tells you that major players were active at that same level. When both signals point to the same zone, the combined case for that level being important becomes much stronger.
This is the core of confluence trading. You are not relying on a single indicator or concept. You are finding spots where multiple pieces of evidence agree with each other. Those spots have a higher probability of producing a meaningful market reaction.
How to Apply This in Practice
To use this in practice, first identify your fair value gap. Then pull up a Volume Profile indicator and check whether there is a significant volume cluster within or adjacent to the gap zone. If the beginning of the gap, your primary entry level, aligns closely with a high volume node, that is a setup worth paying close attention to.
Not every fair value gap will have this alignment, and that is completely fine. When it does occur, treat it as a higher priority setup compared to a gap that sits in a low volume area.
How to Set Up Your Fair Value Gap Indicator on TradingView
You do not need to identify fair value gaps by hand every time you look at a chart. There are free indicators available that will automatically detect and draw them for you. TradingView is one of the best platforms for this, and finding a reliable fair value gap indicator there is straightforward.
Open TradingView and click on the Indicators button at the top of your chart. In the search bar, type “FVG.” Several results will appear. The first result that comes up tends to work well for most traders and is free to use.

The Two Settings Worth Adjusting
Once you add the indicator to your chart, there are two settings worth adjusting before you start using it.
Delete Boxes After Fill
This setting automatically removes a fair value gap from your chart once price has fully moved through the zone. This is a useful setting to have turned on because it keeps your chart clean. Once a gap has been fully filled, it is no longer a valid trade location, so there is no reason to keep it visible.
Extend Boxes
This setting keeps the fair value gap visible on your chart until it is actually tested by price. Without this turned on, some indicators will hide gaps after a certain number of candles have passed, even if the gap has never been visited. Turning extend boxes on ensures you never miss a gap just because it was created a while ago.

Always Do a Quick Manual Check
With these two settings configured, your chart will show you active, unfilled fair value gaps in real time, which makes scanning for setups much faster and easier.
A quick note: some free indicators on TradingView have occasional bugs, where they might draw gaps incorrectly or miss some. Always do a quick visual check by applying the three candle rule manually to confirm that the gaps the indicator is drawing are actually valid. Once you practice the rule a few times, the manual check becomes very fast.
Real Trade Examples Using AUD/USD
Understanding the theory is important, but seeing how it plays out on a real chart makes everything click much faster. AUD/USD on the 30 minute chart is a useful pair for intraday trading because it tends to produce clean, readable price action with well formed fair value gaps.
How to Scan and Filter Setups
When you pull up AUD/USD on the 30 minute timeframe, you will likely see a range of fair value gaps across the chart. Some will be large and obvious, while others will be tiny and barely noticeable. A few will appear in clusters or stacked formations. The key is to filter through them and focus only on the ones that meet your quality criteria.
Look first for the large gaps. They should stand out visually without you having to search for them. A gap that was created by a single large momentum candle is immediately visible and worth noting.
Then check whether any of those gaps are stacked. If you see two or three gaps sitting within the same general area, mark that entire zone as one combined level and note the beginning of the first gap as your entry reference.
Finally, apply the Volume Profile to see which of your remaining gap levels align with a high volume node. If you have a large or stacked fair value gap that also sits on a volume cluster, that is the setup you prioritize.

What to Do When Price Reacts Early
In practice, you will often find that price approaches these high quality zones and reacts sharply. It may not fill the gap all the way. In some cases, price reacts before even reaching the exact level, which still counts as the level having been tested. Once a level has seen a meaningful reaction, it is considered spent. You would move on to the next valid setup rather than waiting for price to return to the same spot.
Choosing the Right Timeframe
The 30 minute timeframe works particularly well for intraday traders because it balances detail and clarity. Shorter timeframes can produce too many small gaps that are hard to filter. Longer timeframes produce fewer gaps but each one carries more weight. Experiment with your preferred timeframe and see where the fair value gap strategy fits most naturally into how you already approach the market.
Conclusion
Fair value gaps are a genuine and widely used tool in modern trading, but their value only shows up when you apply them with some structure. Spotting a gap on a chart is the easy part. Knowing which ones to trade and which ones to ignore is where you build an actual edge.
To summarize what you have learned: a fair value gap forms when one side of the market is significantly more aggressive than the other, creating an imbalance across three candles. The strongest level within any gap is its beginning, which is the high of candle one for bullish gaps and the low of candle one for bearish gaps. The best gaps to trade are large, appear in stacked formations, and align with significant volume clusters on the Volume Profile.
Start by adding a free FVG indicator to TradingView and begin observing how price behaves around these zones. Watch how the market reacts when it returns to a strong, stacked, or confluence backed gap compared to a small isolated one. Over time, your eye for quality setups will sharpen. The fair value gap strategy is not a shortcut or a magic signal. It is a structured way of reading market imbalance, and when used carefully, it can become a consistent and reliable part of your overall approach to trading.
Frequently Asked Questions
What is a fair value gap in trading?
A fair value gap is a zone on a price chart where the market moved so quickly in one direction that it left an imbalance between buyers and sellers. It forms across three candles and shows that one side of the market was more aggressive than the other at that moment.
How do you find the best fair value gaps to trade?
The strongest fair value gaps are large in size, appear in stacked clusters close together, and align with a significant volume cluster on the Volume Profile. A gap that meets all three of these criteria is a high-probability setup.
Where is the best entry level within a fair value gap?
The highest quality entry level inside any fair value gap is the beginning of that gap. For a bullish gap, that is the high of candle one. For a bearish gap, that is the low of candle one. These levels act as support and resistance respectively when price returns to the gap zone.
Next Steps:
If you want to go deeper into Volume Profile trading and see how it combines with other strategies used in real market conditions, visit traderdale.com and explore the courses and tools available there.
INNOVATIONS ANALYST delivered everything they promised. I have been able to refinance my house, buy a new car. They fully recovered my stolen crypto of 195,000 USD, I never thought it was possible. If you have been scammed of your hard earned money send a mail to them at ( INNOVATIONSANALYST @ GMAIL . COM ) , I have referred many friends and even a few family members to their service and they’ve all come back with positive feedbacks to thank me
INNOVATIONS ANALYST delivered everything they promised. I have been able to refinance my house, buy a new car. They fully recovered my stolen crypto, I never thought it was possible. If you have been scammed of your hard earned money send a mail to them at INNOVATIONSANALYST via GMAILCOM
I have referred many friends and even a few family members to their service and they’ve all come back with positive feedbacks to thank me