Hello guys,
hopefully you read my previous articles Market Profile 1 – introduction and Market Profile 2 – different profiles and their application. If not I strongly suggest you to do so. This is the third part of this little Market Profile series. You will probably be confused if you jumped right to this part of it.
Theory time is now over and I think that some real trading examples would be another step forward in your learnig. Now I would like to show you some real examples of how to use Market Profile. All those examples are from trades I published at my website before and traded them later myself along with my friends who follow my levels.
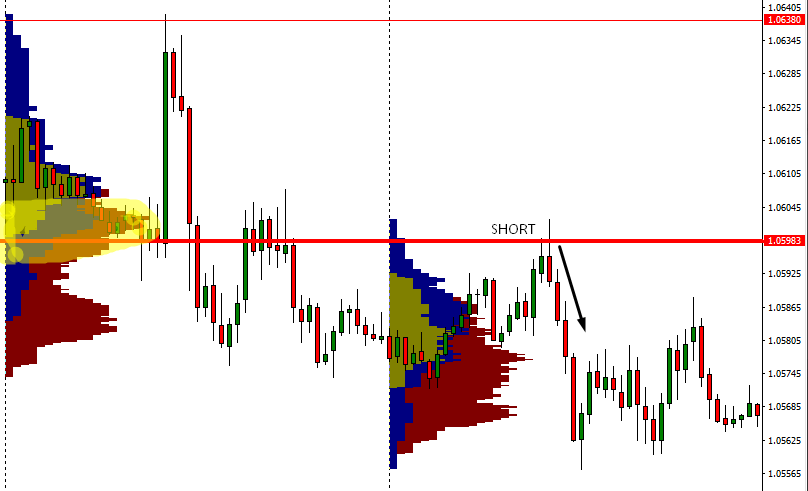
7.3.2017 EUR/USD short 1.0598
In the picture you can identify a “b” shaped profile that indicates aggressive sellers and passive buyers. You can see that my level was placed little bit below the POC of the day. POC in “b” shaped profile works as a strong resistance zone. You see that this time it worked very nicely and that there was very precise and clear reaction to this level.
13.3. 2017 AUD/USD short 0.7592
In this case there was a “thin” profile indicating strong selling activity and a trend day. As I wrote earlier, when there is a “thin” profile I look for volume clusters and I go into a pullbacks in the trend direction from those volume clusters. The 0.7592 was the strongest volume cluster of the day (and also POC of the day). It was very strong level that worked really nicely. As you can see the reaction to this level was extremely precise.

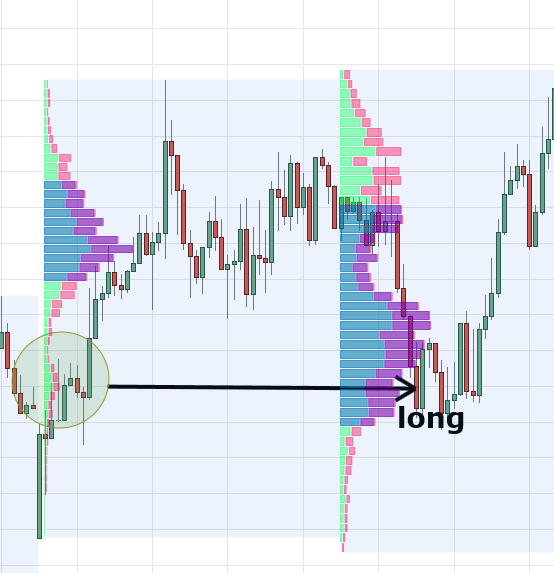
14.3.2017 EUR/USD long 1.0608
This profile (the one on the left) could be seen by many as a “b” shaped profile. Although it has a “b” shape I don’t trade it as a “b” profile because it clearly doesn’t signal strong sellers! In fact this day was an uptrend day. There is one common rule to this. If the profile is to be a valid “b” profile this day’s price needs to close below 50 % of the daily range. If it doesn’t it isn’t proper “b” profile. The same rule goes for “P” profile too (day needs to close above 50 % of it’s daily range to be proper “P” profile.
In this particular situation I traded this profile as a “thin”profile. You can see that this day was indeed a uptrend day with strong and aggressive buyers present.

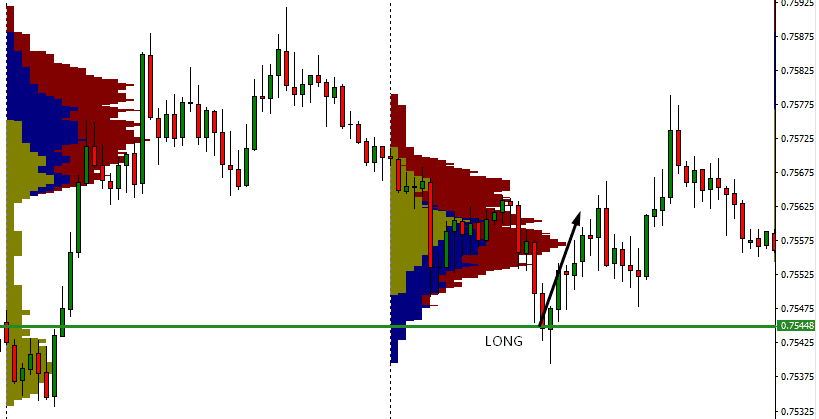
14.3.2017 AUD/USD long 0.7545
In this screenshot you can see a proper “P” profile indicating strong and aggressive buyers and weak sellers. There is a strong support around 0.7540 in the volume cluster in the “thin” leg of the profile. I took my trade little bit higher because I was afraid that the price won’t go so low as to the centre of this volume cluster. This time I was right and the price didn’t quite reach this place. However, generally speaking the level should be a little lower at the highest volume of this volume cluster.
*When I make my levels I don’t only analyze the profile but also price action etc. For that reason this level was not a bit lower.
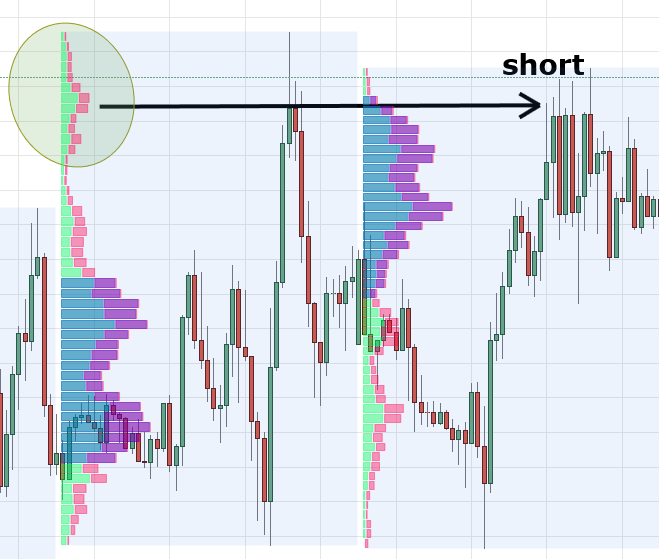
20.3.2017 USD/CAD short 1.3367
This was a typical “b” profile day. If you look at the price action, you can see that there was cummulation of volumes in at the low of the day. After that there was a strong upmove but immediatelly after that there came strong sellers and pushed the price lower again – back into the area of previous cummulation. This signals very strong and aggressive sellers. The most aggression took place in the volume cluster (in the green circle).
When the price returned to this strong resist (the volume cluster zone), those strong and aggressive sellers started to aggresivelly sell again, pushing the price lover once more. You can see that the price turned at this level many times and was quite unable to go past it. Sellers were really strong there.
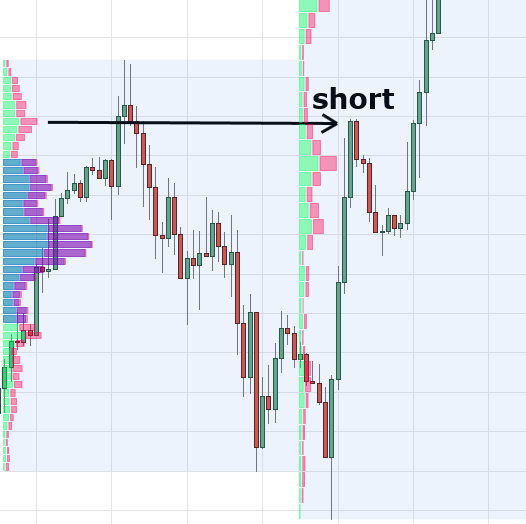
20.3.2017 EUR/USD short 1.0769
In this picture you can see very nice and balanced “D” shaped profile of the day. In this case there was a strong resistance zone at 1.0769 – exactly at the highest peak of the volume cluster. I only took +10 pips profit from there but if I went for more, my profit Target would be at Point of Control (POC) of the day. You can see that this is exactly where the price went after hitting my short level. After hitting POC it went it’s own way up. It was really a good place for a profit target there.
21.3.2017 AUD/USD short 0.7705
Here you can see a perfect “P” profile. buyers were very aggressive from start of the asian sesion pushing the price higher. After that there was some rejection of higher prices in the euro session but it wasn’t too strong and the day continued in a cummulation of volumes above 50 % range of this day’s range. This clearly indicated strong and aggressive buyers.
My long position was at the highest volume of a volume cluster created in the asian session. in this place the buyers become aggressive and started their aggressive buying activity.I was hoping that if the price came back to this level (0.7705) those strong buyers will become aggressive again and that they will push the price again once more. I was right. You can see that the next day the sellers absolutelly couldn’t go past this strong support area. I ended this position in +10 pips profit. However, it was possible to go for more. The ideal place for yur profit would be at this day’s (21.3.)POC.
This is the end of my free Market Profile course my friends. I hope I described you well the basics of MP and the way I trade using it. Market Profile is an excellent tool and I strongly suggest that you download it from my webpage and start watching the things I showed you and implement those things into your own trading!
Thanks for reading and happy trading!
Dale
Hi,
Thanks for empowering us with knowledge and i hope we can become profitable too.
Thanks
So we look at the previous Market Profile?ignore the present 1?
By the way,what’s the timeframe u use most often ?
For the last picture(21.3.2017 AUD/USD),why do u choose the very small area as ur resistance/buy signal?I tot u will only look at POC or high volume area?
You dont have to ignore the present. Just be aware if some level was already tested or not. Look at my market profile 2 article. Then you will probably know why Is ometimes look even for smaller volume clusters and just POC levels.
Dale,
Many many thanks for your knowledge and short course.
It is really useful and precise to description important note.
You are awesome!!
Thank you so much.
Thanks for your feedback mate! Iam glad you like it!
Very good stuff! I am confused as to why you show the volume clusters at 2, 3, or even 4 different times throughout the day? And then which one are you basing your trades on?
Thanks Dale
Iam not sure what you mean. Could you elaborate?
Hi dale! This is an awesome strategy! Thank you for sharing. I have a few questions do you aim for only 10 pips a day? Also what time/session does this method work the best? Thanks
Bought the books sir ,watching the videos on volume profile and reading the articles ,very interesting lessons and this trade examples help a lot also thx for the effort.