Welcome to this comprehensive guide on one of the most powerful tools in a professional trader’s arsenal. In this article, I draw on my 10 years of experience in the financial markets to show you exactly how to trade using Volume Profile and POC concepts through the lens of the Anchored VWAP. If you have ever felt like the market reverses the second you enter a trade, it is likely because you are buying at an “unfair” price. Most retail traders chase momentum when it is already overextended, but the “smart money”—the big banks, hedge funds, and high-frequency algorithms—operate differently. They are constantly searching for the “fair price,” a mathematical average that balances price movement with actual trading volume.
The Anchored VWAP (Volume Weighted Average Price) is the ultimate tool for finding this balance. Unlike standard moving averages that treat every minute of the day the same, the Anchored VWAP allows you to pick a specific starting point—a “birth” of a new market move—and track the average price from that moment forward. Whether it is a major economic announcement, a massive price peak, or the start of the trading week, anchoring your indicator to these events gives you a roadmap of where big players are likely to defend their positions. My goal today is to move you away from guesswork and toward a structured, rules-based approach that identifies high-probability entry points by following the footprints of institutional giants.
Table of Contents
Summary of the Article
The Core Concept: Anchored VWAP calculates the “fair price” starting from a user-defined significant event.
Institutional Edge: Since big players use VWAP for execution, these levels naturally act as strong support and resistance.
Swing Point Anchors: Identify the most obvious highs and lows to find “fair value” pullbacks.
The Weekly Anchor: A vital intraday tool that uses the start of the week as a psychological and technical baseline.
Volume Profile Synergy: Combining VWAP with high-volume rotation zones identifies where aggressive trend starters will defend their trades.
What is Anchored VWAP and Why Does It Work?
Before we dive into the setups, we need to understand the Anchored VWAP (Volume Weighted Average Price). Unlike a standard moving average, which only looks at price, the VWAP looks at both price and the amount of trading volume. This makes it a much more “real” indicator of what is happening in the market.
When we “anchor” the VWAP, we tell the indicator exactly where to start calculating. This is crucial because not every moment in the market is equal. By picking a significant starting point—like a massive price peak or the opening of the market—we create a line that represents the average price paid by all traders since that specific event.
In this article, I draw on my years of experience to explain that the Anchored VWAP acts as a magnet for the market. Why? Because big institutions (the “sharks”) don’t just click “buy” or “sell” randomly. They need to fill huge orders without moving the price too much against themselves. They want a “fair price.” If the price is way above the VWAP, it’s too expensive to buy. If it’s right at the VWAP, it is considered “fair value.” When the price returns to this line, these big players often step back in to add to their positions, creating the bounces and reversals we see on our charts.

Setup 1: Anchoring to Major Swing Points (The "Peak" Strategy)
The first strategy is perhaps the most popular: anchoring to a major swing point. A swing point is a prominent high or low on your chart—a place where the price clearly changed direction. Think of these as the “peaks” and “valleys” that every single trader can see.
To use this setup, you look for a peak that stands out. You anchor your VWAP to the exact candle that formed that high. Once the price starts falling away from that high, you wait. You are waiting for a pullback. When the price climbs back up and touches that blue VWAP line, that is your signal to go short.
Why does this work?
That swing point represents a shift in sentiment. If the price hit a major high and then fell, it means sellers took control. Those sellers want to keep prices down, but they also want to sell more at a “fair price.” The Anchored VWAP from that high tells them exactly where that fair price is. When the price hits that line, algorithms and institutions trigger their sell orders. This is why you often see the price “kiss” the VWAP line and then immediately drop.
This works just as well for long trades. Find the lowest point on the chart (the prominent low), anchor your VWAP there, and wait for the price to move up. When it eventually dips back down to touch the VWAP, you enter a long trade. You aren’t guessing; you are trading at the same level where the big players are likely to buy. Remember, in this article, I draw on my 10+ years of experience to tell you: do not fight the trend. If the anchor is at a low and the price is above it, only look for long entries.

Setup 2: Anchoring to the Start of the Week for Intraday Success
Many traders struggle because they don’t have a “home base” for their analysis. The Start of the Week Anchor provides exactly that. For intraday traders, the beginning of the trading week is the most significant time-based event. It is when new weekly positions are opened and when the “narrative” for the next five days begins.
To execute this, you anchor your VWAP to the very first 30-minute candle of the week. This line now acts as the “Standard” for the entire week. If the price is consistently trading above this line, the bulls are in control, and the VWAP acts as a dynamic floor (support). If the price is below it, the bears are in control, and the line acts as a ceiling (resistance).
In this article, I draw on my experience to remind you that this setup works best in trending markets. If the market is moving sideways in a tight range, the VWAP will sit in the middle of the price action, and you will get “whiplashed” as the price crosses it repeatedly. However, when you see a strong move away from the weekly open, the first touch of that VWAP is one of the highest-probability entries you can find. It represents the “average” price for the entire week, and institutions are very keen on defending that average.

How to trade it:
Open a 30-minute chart of a liquid instrument like EUR/USD or the S&P 500 (ES).
Find the first candle of the current week.
Anchor your VWAP to that candle.
If the price is trending above the line, the VWAP is Support. Look to buy when price touches it.
If the price is trending below the line, the VWAP is Resistance. Look to sell when price touches it.
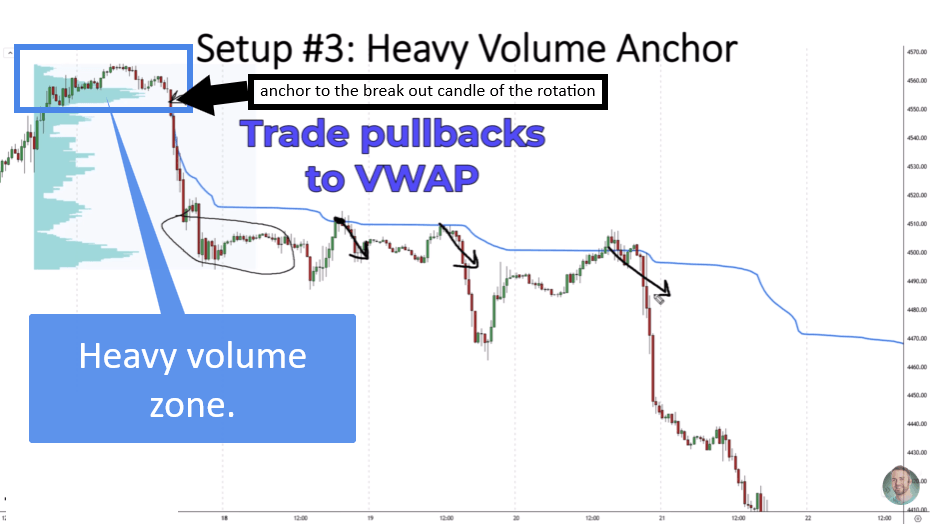
Setup 3: How to Trade Using Volume Profile and POC in Heavy Volume Zones
This is the most advanced setup because it combines the “when” of the VWAP with the “where” of the Volume Profile. A heavy volume zone (often called a High Volume Node or Point of Control) is a price area where a massive amount of trading took place. Usually, this happens during a “rotation”—a sideways move where big players are loading up their positions.
When you see a heavy volume zone followed by a violent breakout, you know that a major institution has finished building their position and is now pushing the price. In this article, I draw on my years of experience to tell you: anchor your VWAP to the start of that breakout. Specifically, anchor it to the last candle of the rotation or the first candle of the trend move.
By doing this, you are tracking the fair price of the “aggressive” money that started the trend. When the price eventually returns to this VWAP line, you are at the exact level where the trend-starters will likely protect their “breakout” price. This “confluence” of Volume Profile and Anchored VWAP is a hallmark of professional trading. It allows you to enter trades with tight stops and massive profit potential because you are aligned with the most aggressive participants in the market.
The Strategy:
Identify a zone with heavy volume (a “High Volume Node”). Wait for the price to break out of that zone in a strong trend. Then, anchor your VWAP to the candle that started the breakout. This is usually the last candle of the sideways rotation.
Because so much volume was traded in that zone, the VWAP starting from that point is incredibly powerful. The players who started the trend from that volume zone will want to defend their positions. When the price returns to the “fair price” (the VWAP) since that volume accumulation, they will often step in to push the price back in the direction of the trend.
In this article, I draw on my expertise to remind you that patience is key here. Sometimes the price takes hours or even days to return to that VWAP line. But when it does, the reaction is often very sharp. This is especially true on the S&P 500 (ES) where algorithms are constantly scanning for these volume-based fair price levels.
Conclusion: Elevating Your Trading Strategy
Mastering the Anchored VWAP is about more than just adding another line to your chart; it is about changing your perspective on how the market functions. In this article, I draw on my 10 years of experience in field trading to emphasize that success comes from alignment. When you align your entries with the “fair price” levels used by the world’s largest financial institutions, you stop gambling and start trading with an edge. We have covered three distinct ways to find these levels: using the visual clarity of major swing points, the temporal significance of the weekly open, and the structural power of heavy volume zones. Each of these setups provides a logical, data-backed reason to enter a trade, allowing you to filter out the noise of the “retail trap” and focus on where the real money is moving.
Remember, the goal of a professional trader is not to predict the future, but to react to the present with a disciplined plan. By using these Anchored VWAP strategies, you are giving yourself a roadmap that reveals the hidden support and resistance levels built by institutional volume. Trading is a journey of constant refinement, and adding these volume-weighted tools to your repertoire is a significant step toward consistency. I encourage you to go back to your charts today, apply these anchors to recent major moves, and see for yourself how often the price respects these “fair value” zones. The market may seem chaotic, but underneath the surface, it is a search for value.
Here are the questions I get asked most about Anchored VWAP:
For intraday and swing trading, the 30-minute chart is my sweet spot. It gives you enough data to see clean VWAP reactions without the noise you get on a 1-minute chart. That said, the beauty of Anchored VWAP is that the logic scales across timeframes — anchor to a major swing high or low on the daily chart and it works just as well for multi-day swing trades. The timeframe matters less than where you anchor it from.
Anchor to significant structural turning points — major swing highs, swing lows, gap opens, or key earnings/news events. The idea is that you’re measuring the average price since a specific market event that mattered. Anchoring to a random date or a minor pullback gives you a meaningless line. The three most reliable anchors are: the start of a trending move, the highest or lowest point of a swing, and major gap-down or gap-up opens where institutional positioning shifted.
Yes — and it’s often more powerful that way. I regularly use two or three simultaneously, anchored to different structural points. When two Anchored VWAPs converge at the same price level, that confluence zone carries significantly more weight. One VWAP at a level is a signal; two independent VWAPs at the same level is a high-conviction trade setup.
A standard daily or rolling VWAP resets at the same time every day regardless of what the market has done. Anchored VWAP resets from a specific event you choose — a swing high, a news spike, a gap. This means it’s always contextually relevant to the current market structure rather than an arbitrary time reset. In a trending market, the anchored version gives you a much more accurate read of where the average price has been since the trend began.
Yes, but with a caveat. Spot Forex is decentralised, so there’s no single global volume number — what your broker shows as volume is tick volume (a count of price changes, not actual contracts). This makes VWAP less precise in spot Forex than in futures or stocks. For the cleanest Anchored VWAP signals, I recommend trading currency futures (6E, 6A, 6J on the CME) where you have genuine centralised volume data. The good news is that currency futures track spot Forex pairs almost identically, so the levels translate directly.
Place your stop beyond the VWAP level you entered from — if you entered long at the Anchored VWAP, stop below it. If you entered at the first deviation band, stop beyond the band. The logic is that if price closes through the VWAP level with conviction rather than just wicking through, the level has failed and you want out. For added precision, combine the VWAP level with a Volume Profile node — when both align, the stop placement becomes more natural because you’re placing it beyond a zone that has structural meaning, not just a calculated line.