If you’re staring at a chart covered in indicators and none of them are helping — I’ve been there. For most of my first few years of trading, my charts looked the same way. What changed everything for me was stripping it back and focusing on one tool that actually makes sense: VWAP.
My name is Dale. I’ve been trading the financial markets for 16 years, and VWAP — the Volume Weighted Average Price — has been part of my toolkit for most of that time. The reason is simple: it combines price with volume, which means it tells you both where the market is trading and how much activity is happening at that level. Most indicators only give you one of those two pieces of information.
In this guide, I’m going to walk you through the VWAP setups I actually use — including how to read sideways markets, how to trade trending markets, and how combining VWAP with a Volume Profile creates high-probability trade setups. Same content as the video above, but in written form.
Table of Contents
What is VWAP and Why Does It Matter?
Most moving averages only look at price history. VWAP is different — it factors in volume at each price level, which means it reflects where the actual trading activity has been concentrated, not just where price happened to be.
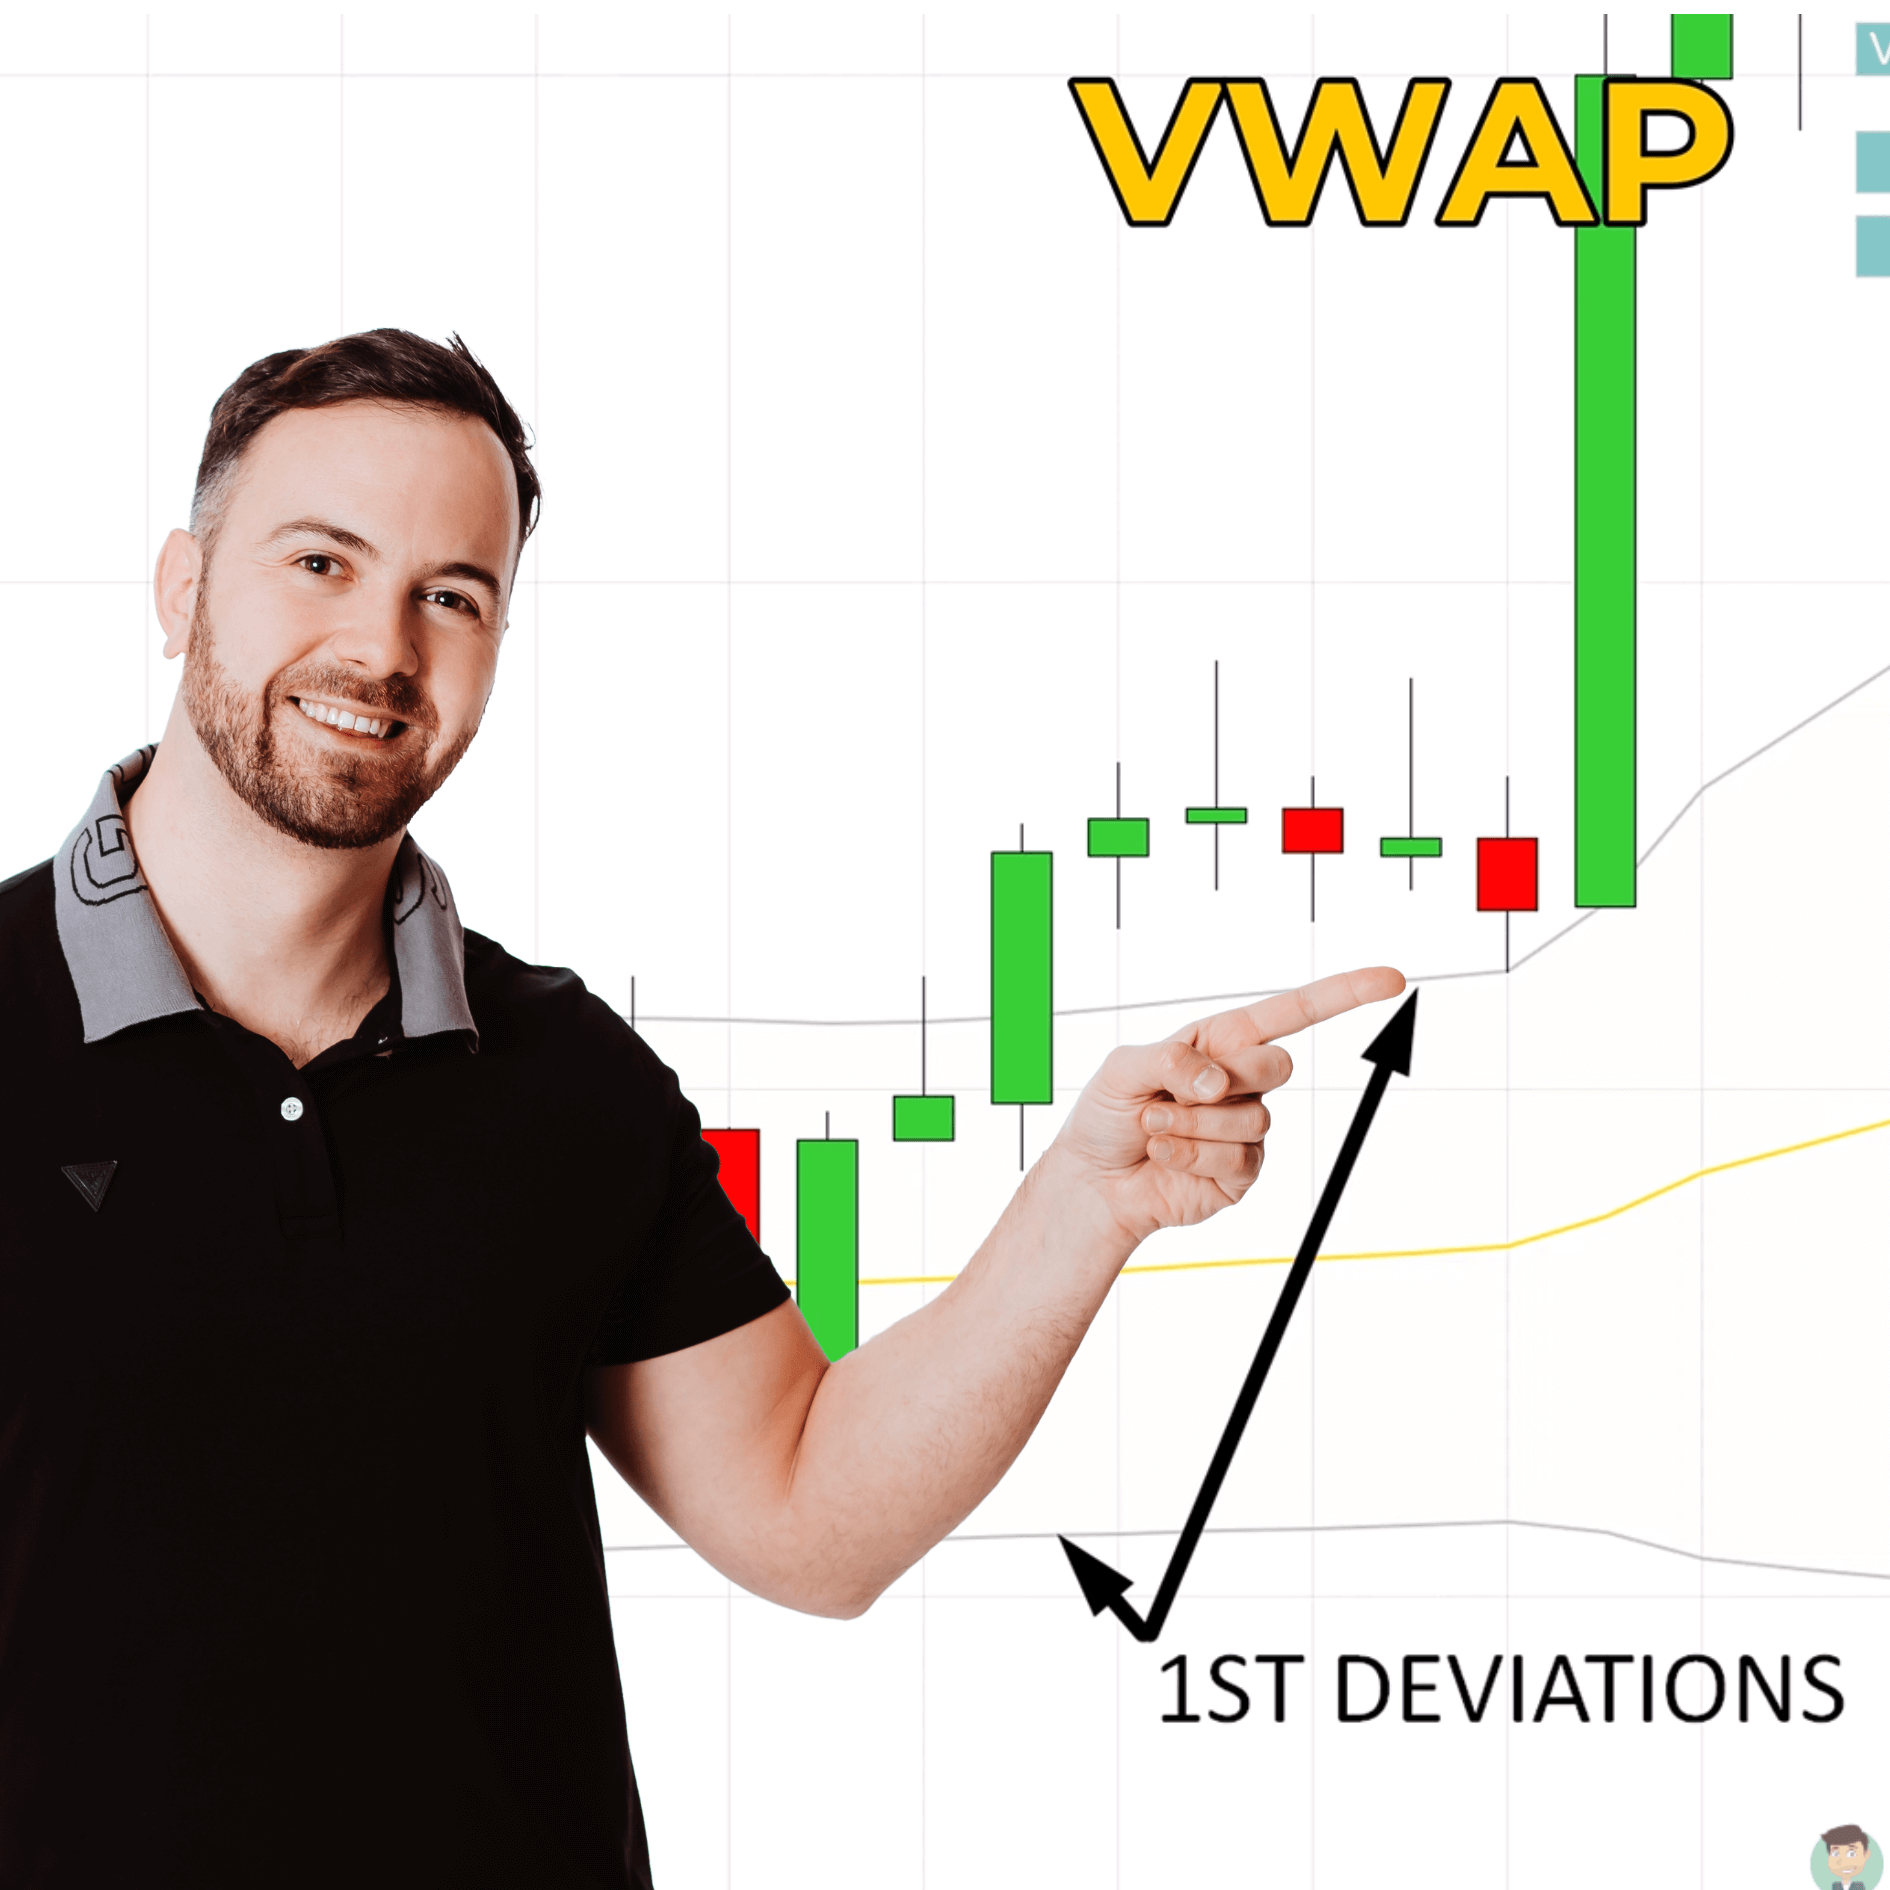
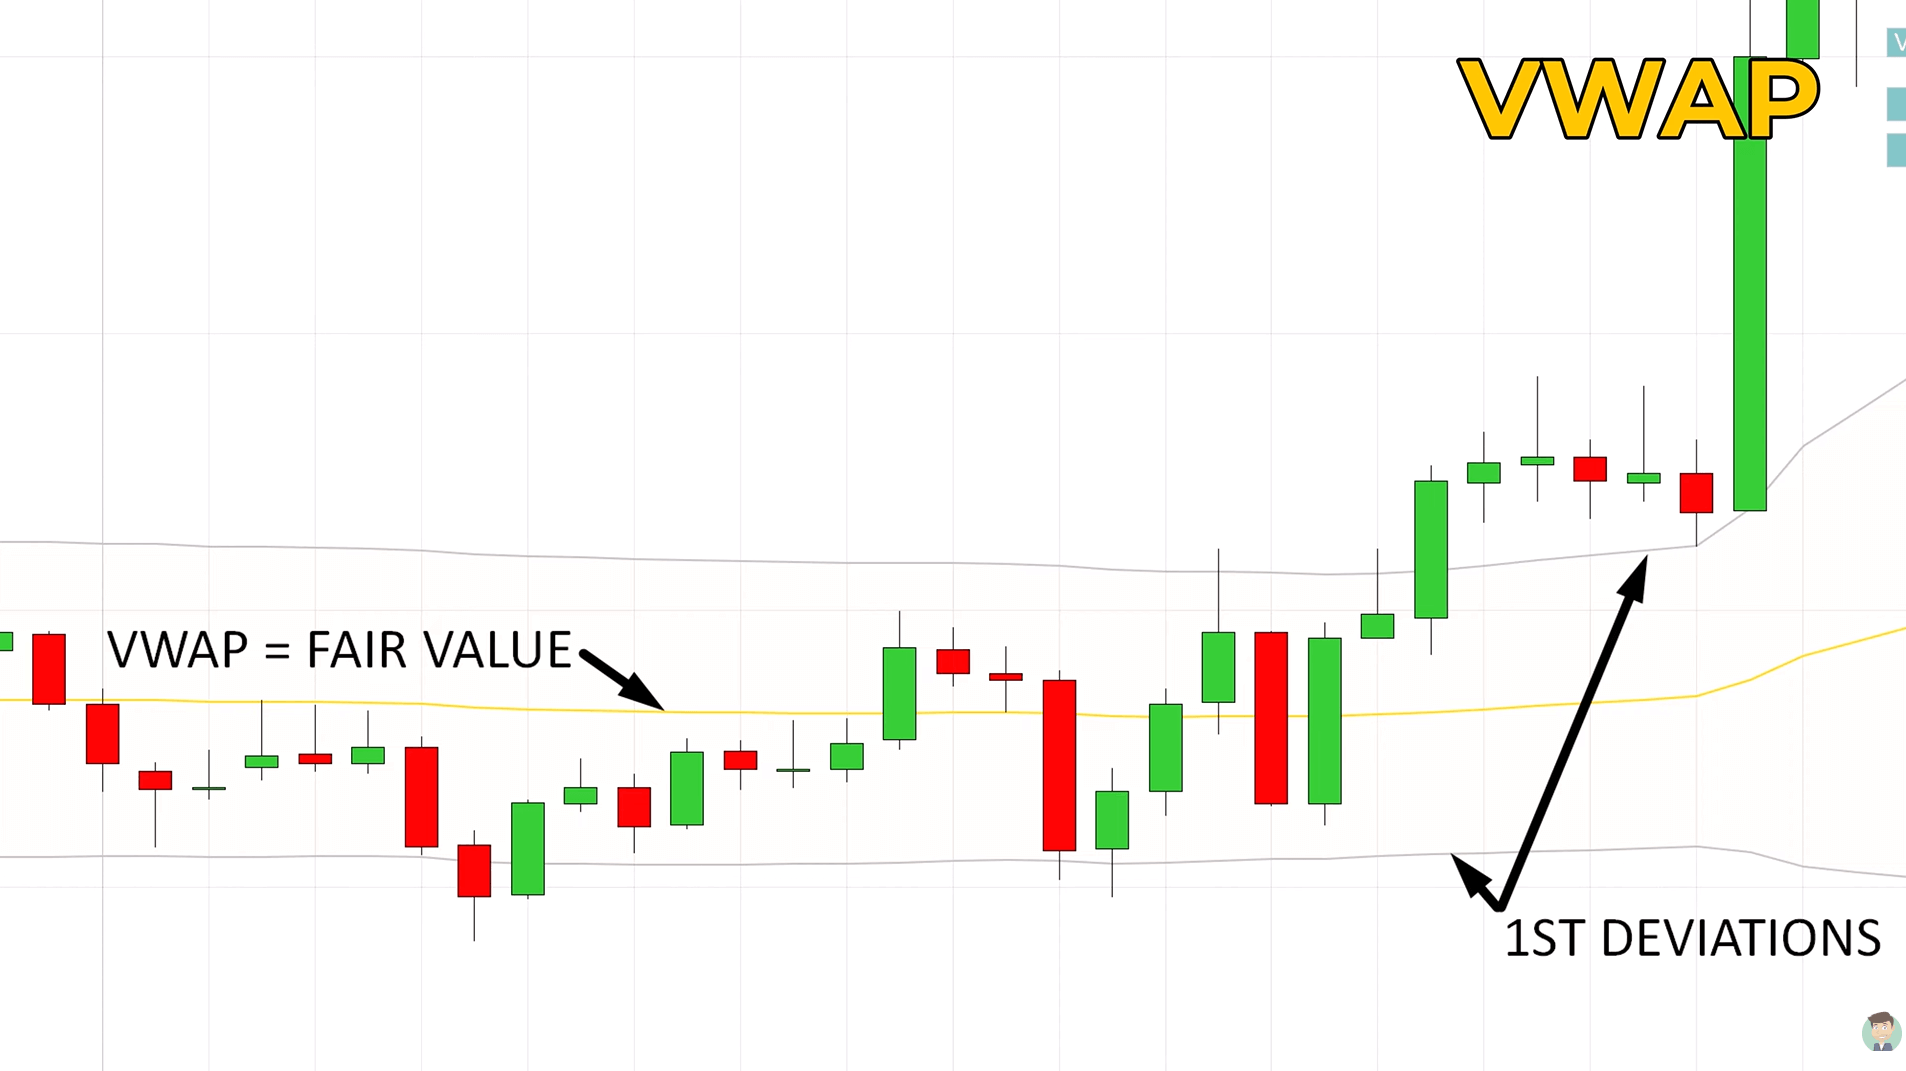
Think of VWAP as the market’s “fair value” line. If price is significantly above VWAP, the market is extended — it’s trading at a premium. If it’s well below VWAP, it’s at a discount. Large institutions use VWAP as a benchmark for their execution, which is one of the reasons the levels it creates tend to act as genuine support and resistance.
The tool I use has three components: the central VWAP line (shown in yellow on my charts) and two standard deviation bands above and below it (the grey lines). Those deviation bands are what make it actionable. They tell me whether the market is ranging or trending, and where to place my entries. I’ll show you exactly how to read them in the sections below.
1. The Rotation Setup: How to Trade Sideways Markets
Markets don’t trend all the time. In fact, they spend the majority of time moving sideways — what I call a “rotation.” This is where most trend-following traders get hurt: they keep trying to find a breakout that isn’t coming and get whipsawed back and forth.
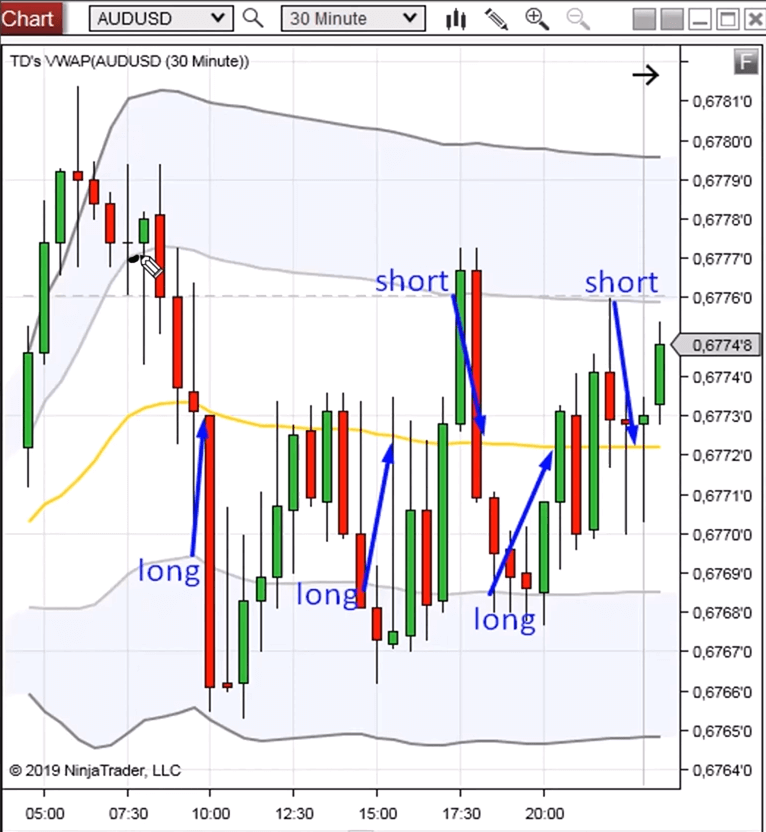
The Rotation Setup is designed specifically for these sideways conditions. Instead of fighting the range, you trade it. The first deviation bands become your boundaries — sell at the top, buy at the bottom — with the central VWAP line as your take-profit target.
How to Identify a Rotation
The first thing I check is whether the grey deviation bands are moving horizontally. If they’re going sideways, the market is calm and the Rotation Setup applies. If they’re sloping up or down, that’s a trend — and you’d use a different approach, which I’ll cover next.
The horizontal deviation bands are your confirmation that price is in a range. Don’t try to pre-empt this — wait for it to be clear before entering.
Entry and Exit Rules
In a rotation, the rules are straightforward:
- Long (Buy): When price touches the lower first deviation band. That band is acting as support in the range.
- Short (Sell): When price touches the upper first deviation band. That band is acting as resistance.
- Take Profit: The central yellow VWAP line. In a sideways market, the VWAP acts like a magnet — price is drawn back to it repeatedly. That’s where I close the trade.
The stop-loss goes just beyond the band you entered from. If the band breaks convincingly, the rotation is over and you want out.
2. The Trend Setup: Catching the Big Moves
When the market picks a direction and starts moving with real momentum, the Rotation Setup doesn’t work. Price rides the deviation band rather than bouncing off it. Trying to fade a strong trend will get you stopped out over and over.
This is when I switch to the Trend Setup. Same tool, same bands — completely different approach. Now instead of selling at the top band, I’m using it as my pullback entry level to trade with the trend.
Identifying a Strong Trend

I read the trend condition the same way I read the rotation — through the deviation bands:
- Uptrend: The first deviation band is sloping upward and price is consistently staying above it.
- Downtrend: The first deviation is sloping downward and price is consistently staying below it.
If you see this pattern, you’re in a trend. Don’t fight it and don’t try to pick a top or bottom — use the pullback strategy below instead.
The "Pullback" Strategy

Chasing a trend at full extension is one of the most common mistakes I see. You buy the high, price pulls back immediately, you get stopped out — and then it continues higher without you.
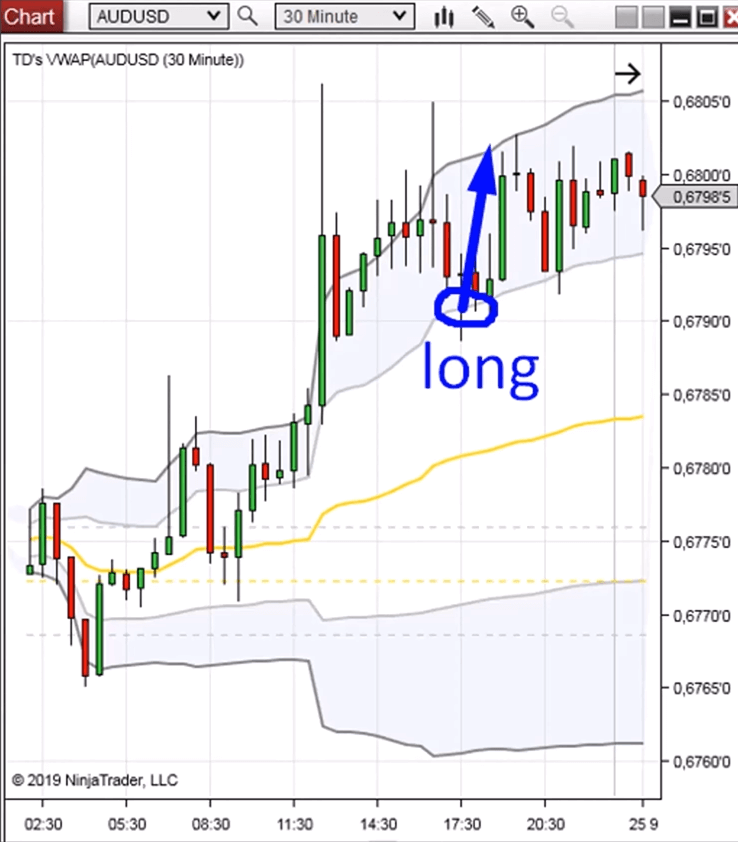
The Trend Pullback approach solves this. Once I identify a trend, I wait for price to pull back to the first deviation band and enter there. I’m getting in at a better price, with the trend still intact, and with a logical stop-loss level just beyond the band.
In a downtrend: wait for price to retrace back up to the upper deviation band, then short. In an uptrend: wait for price to pull back down to the lower deviation band, then long. This gives you multiple entries on the same trend rather than just one all-in punt at the beginning.
3. The Pro Bonus: VWAP Plus Volume Profile
VWAP alone is already a solid edge. But when you add a Volume Profile to the mix, the quality of your setups goes up significantly. Two independent tools pointing to the same level at the same time — that’s what I call confluence, and it’s where I find my best trades.

Why Volume Profile Works
The Volume Profile shows you exactly where the most trading activity happened at each price level. A wide bar (high volume node) on the profile means a huge amount of contracts changed hands there — that’s where institutions were building their positions.
Because those players traded such large sizes, they have a vested interest in defending those levels if price returns to them. That’s the structural logic behind why volume nodes act as support and resistance — it’s not a random indicator signal, it’s a direct reflection of where large money entered the market.
This is why I’ve been covering Volume Profile for years and it’s the core of what I teach in my trading course. It works because it shows real institutional activity, not derived calculations.
The Power of Confluence
Here’s what a confluence setup looks like: you’re in a downtrend with the VWAP first deviation sloping downward. Price pulls back toward the upper deviation band. At the exact same level, the Volume Profile shows a major volume peak — a previous high-volume node from a recent trend move.
Two things are pointing to the same level: VWAP says this is where the trend pullback entry is, and Volume Profile says this is where institutions are loaded. When you see both aligning, your conviction in the trade goes up — and so does your ability to hold it without second-guessing yourself at the first sign of noise.
This confluence approach is also what I cover in detail in the Cumulative Delta guide — adding a third layer of confirmation using delta divergence.
Real-World Examples: From Long-Term to Intraday
Let me show you what this looks like on actual charts. I’ll cover two scenarios: an intraday setup on a 30-minute chart, and a swing setup on a 60-minute chart.
The Intraday Scenario (30-Minute/60-Minute Charts)

On the 30-minute chart, I’m using “prior day” VWAP data — the first deviation line from the previous session is projected forward as a dotted line. This is useful because it shows where the previous day’s VWAP boundary sat, and those levels often carry over as reference points the next session.
In this setup, there’s a Volume Accumulation Area (a wide volume node) from a previous bullish move. When price retraces and hits both the prior-day VWAP deviation line and that volume node simultaneously, you have your confluence entry. Both signals say the same thing: this level matters. I enter long, with the stop just below the cluster.

On the 60-minute chart, I’m using a weekly VWAP. The Volume Profile shows a major cluster from a strong bullish leg. As price retraces, it touches both the weekly VWAP first deviation and the high-volume node at the same price.
Same logic, bigger timeframe. The weekly VWAP carries more weight because more participants are watching it. Combined with the volume evidence, it creates a high-conviction long setup — and these are the trades I most enjoy taking because the two independent systems are telling me exactly the same thing.
Before I take any VWAP trade, I run through this quick checklist:
- Check the deviation bands — are they horizontal (rotation) or sloping (trend)? That determines which setup applies.
- Identify your entry level — in a rotation, it’s the upper or lower band. In a trend, it’s the first deviation band on a pullback.
- Check the Volume Profile at that level — is there a significant volume node (wide bar) at the same price? If yes, that’s confluence and the setup gets a higher weight.
- Set your target — in a rotation, the central VWAP line is my primary take-profit. In a trend, I look for the previous swing high/low or the next significant volume node.
- Confirm you’re not fighting a bigger trend — check the higher timeframe VWAP before entering on the lower timeframe.
This process only takes a minute or two, but it filters out a lot of low-quality setups before they cost me money.
Conclusion: Building a Professional Trading Plan
After 16 years, VWAP is still one of the clearest tools I know. The reason is simple: it respects both price and volume. Most retail traders only look at price. By incorporating volume, you get a more honest picture of what’s actually happening in the market.
The Rotation and Trend setups I’ve described here work because they’re based on logical market behaviour — the way institutional algorithms use VWAP as a benchmark. When you add Volume Profile confluence, you’re stacking evidence rather than hoping one indicator is right.
If you want to build on this, check out my guide on trailing your stop-loss with Volume Profile — it’s the natural next step once you’ve got your entry dialled in. And for those running prop firm accounts or looking to grow capital, the Funded Trader Academy covers how I apply these strategies in that specific context.
Frequently Asked Questions (FAQ)
Here are the questions I get asked most often about trading with VWAP setups:
Look at the first standard deviation bands. If they are moving horizontally — essentially flat — you’re in a rotation and the Rotation Setup applies. If the bands are clearly sloping upward or downward with price consistently riding one side of them, you’re in a trend. This is the most important read you’ll make before placing any trade. Getting this wrong means using the wrong setup in the wrong market condition, which is one of the most common reasons traders get chopped up.
In a strong trend, price rarely pulls back all the way to the central VWAP line — it’s too far from current price for a meaningful pullback entry. The first deviation band is closer to price action and gives you a shallower, more realistic pullback level to enter from. Using the VWAP line itself in a trend means either waiting a very long time for the entry or missing the move altogether. The first deviation is the practical sweet spot.
Confluence means two or more independent signals pointing to the same price level at the same time. In my VWAP approach, the most powerful confluence is when the first deviation band on a pullback aligns with a significant Volume Profile node (high-volume area) at the same price. One signal gives you a reason to enter; two independent signals give you significantly higher confidence that the level will hold. I’ve been using VWAP and Volume Profile together for years — the confluence setups consistently produce my highest-probability trades.
VWAP works across timeframes. A daily VWAP is useful for intraday traders on 30-minute or 60-minute charts. A weekly VWAP is useful for swing traders on daily charts. A yearly VWAP gives you a long-term reference for position traders. The key is matching the VWAP period to your trading timeframe. I use multiple VWAP periods simultaneously — daily, weekly, and sometimes monthly — which gives me a broader view of where institutional ‘fair value’ sits across different horizons.
Sometimes the deviation bands are flat but narrow, and price is chewing through the middle without clean rotations to the bands. In that case, I don’t trade it. There’s no edge in forcing entries on a choppy, compressed VWAP. Wait for a clear rotation where price reaches the actual band, or wait for the bands to start sloping decisively — that signals the market is transitioning to a trend. Patience in ambiguous market conditions is a skill in itself, and it saves you a lot of bad trades.
Yes — I avoid entering new positions in the 15-30 minutes before and immediately after major scheduled news releases (CPI, NFP, Fed decisions, etc.). News events can spike price through VWAP levels that would otherwise hold cleanly, triggering your stop for reasons that have nothing to do with the structural setup. The VWAP level is still valid — the news just overrides the normal price discovery mechanism temporarily. Wait for the spike to settle, let price find its new VWAP relationship, and then look for setups again. Trying to trade the initial news candle with VWAP is low probability regardless of what the level looks like.
The most common issues I see: trading the wrong market environment (using the Trend Setup in a rotation, or the Rotation Setup in a trend), not waiting for price to actually reach the deviation band before entering (entering ‘close enough’ rather than at the actual level), and ignoring the higher timeframe context (going long at the daily VWAP band when the weekly VWAP says the market is in a downtrend). Fix these three things and most VWAP approaches improve significantly. The strategy itself is sound — the breakdown is almost always in the execution of the environment read.