Video Transcript:
Hello
everyone, it’s Dale here. Welcome to the new video from the Recent Trade
series. In this video, I’d like to talk about a trade I took recently on GBP/USD,
focusing more on Order Flow and how it can be used as confirmation to turn a
risky setup into a high-probability trade. I’ll show you a couple of tricks and
walk you through a real trade I took yesterday.
Let’s
start by looking at the chart. First, I’ll discuss the reasoning behind the
trade, and then we’ll dive into the Order Flow confirmation and focus on that.
What you see before you is the NinjaTrader 8 platform and a 30-minute chart of GBP/USD.
Let me scroll back a bit so I can show you the reasoning behind this trade. The
level the trade was based on was almost a month old, but that’s fine by me. It
was based on a rejection of lower prices and on a volume cluster that formed
within the rejection. The level was right here where you see the blue line, and
if I scroll forward a bit, you can see how the price reacted to that level.
The
first thing I need to mention is that when I took this long position, I
considered it a risky trade because I was trading against a very strong
sell-off, especially this candle. This move was a reaction to unexpected news
regarding tariffs. Because of that, I really wanted to see some kind of
confirmation that the big players were stepping in and that this level was
actually going to hold. I didn’t want to trade this blindly.
Now,
let me show you what occurred on Order Flow as the price approached this long
level. What you see here is my Order Flow workspace. The blue line you see on
all these windows is the level I wanted to trade.
First,
let’s look at this chart. This was the support level, and the price was heading
toward it. When the price reached the support, I got my first confirmation, and
it was a strong one. If you look at these two cells, you can see that massive
volumes were traded, both on the bid side and the ask side of the footprint.
This is the bid, and this is the ask. You can see that the volumes here were
significantly larger compared to the volumes traded before that.
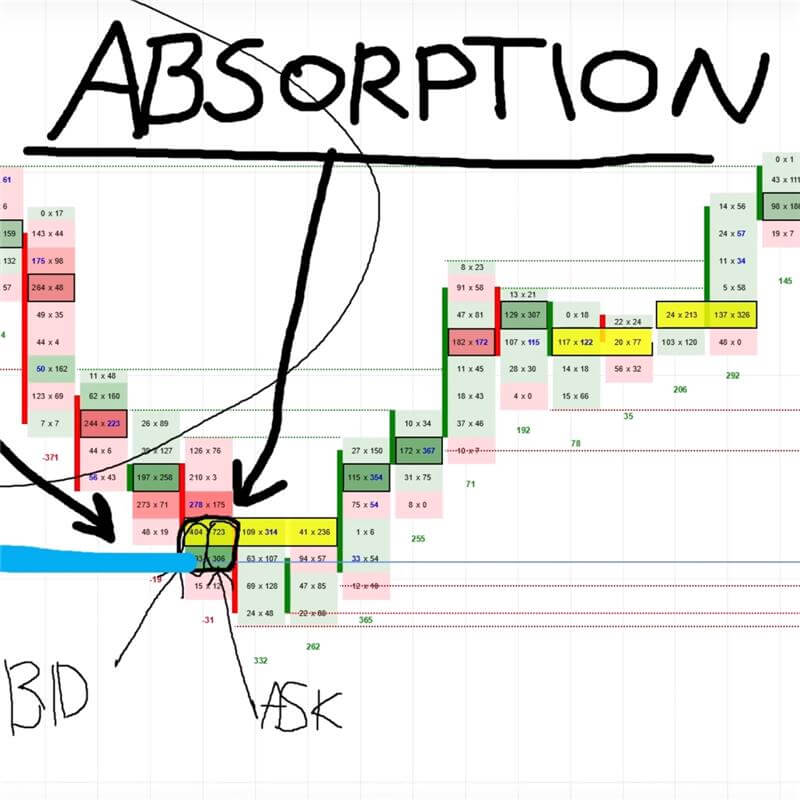
This
is an Order Flow confirmation setup that I call the Absorption Setup.
Absorption occurs when you see heavy volumes at a strong support or resistance
level. In this case, we had a support level, and the absorption took place
exactly at that level. This told me that big players recognized this level and
wanted to trade it as well.
Now,
if we look closer, you can see those heavy volumes on the bid side. This
indicates that sellers were selling aggressively. However, we also see heavy
volumes on the ask side, which means that buyers were buying everything the
sellers had to offer. That’s why the price didn’t continue to move
downwards—buyers were absorbing the selling pressure. This was the first
confirmation for me to enter the trade.
Now,
the second confirmation came from Delta. Delta is simply the difference between
the strength of aggressive buyers and aggressive sellers. After the absorption
took place, the Delta, which you can see below each footprint, turned strongly
positive. This indicated that buyers were dominating, providing another
confirmation to enter the trade.
This
is better visualized on the cumulative delta chart. Here, the blue line
represents our support level. The top chart is a one-minute chart of GBP/USD,
and the chart below that is the cumulative delta, which measures the difference
between aggressive buyers and sellers in real time.
What’s
important here is the divergence between price and delta. The price was
dropping toward the support level, hitting it and continuing a few more pips
down. However, during this period, the cumulative delta started to rise
dramatically. This divergence suggested that buyers were stepping in, despite
the price moving slightly lower. Price often follows delta, so when delta
started to rise, it was a strong indication that the price was likely to
reverse and move upwards, as it did.
This
was a strong confirmation that buyers were reacting to the support level,
likely reversing the price direction. This confirmation helped turn what
initially seemed like a risky trade into a high-probability setup.
I
hope you found this Order Flow analysis helpful. If you want to learn
everything about Order Flow trading and get your hands on my custom-made Order
Flow software, the one you saw in this video, head over to my website at Trader-Dale.com. If you click the “Trading
Course and Tools” button, it will take you to a page where you can check
out my educational and indicator packs. If you’re interested in Order Flow
trading, the Order Flow pack is the best choice. It includes a complete video
course on Order Flow trading, my custom-made Order Flow and cumulative delta
software, and my Volume Profile software for multiple trading platforms.
Additionally, you’ll get tech support, meaning we’ll install everything for
you, so you don’t have to worry about the technical stuff.
If
you want to get all the packs together, scroll down a bit further and you’ll
find a discounted bundle that includes all four packs.
That’s
all for this video. Thanks for watching, and I’ll see you next time. Until
then, happy trading.