Prefer an article? Go here: How to Read Order Flow: A Simple Guide to Trading Like the Big Guys
Do you want ME to help YOU with your trading?
Video Transcript:
Most traders
open the Order Flow software and they have no idea what they’re looking at.
It’s just numbers flying everywhere. It’s a matrix. They can’t really make
heads or tails of it. But in this video, we’ll break everything down and I’ll
show you the most important things you need to know when reading the order
flow. We’ll talk about volume clusters, high-volume nodes, imbalances, delta,
cumulative delta, and so on. And in the end, I’ll also show you how to organize
everything together to create your own order-flow workspace. All right, so
let’s get to it. The first thing, and maybe the most important thing, is volume
clusters. A volume cluster is a place where heavy volumes were traded. It’s
important because big trading institutions usually reveal their trading
activity in those volume clusters. On the screen, there are two significant
volume clusters here. It’s this one and this one. When you see a volume
cluster, it’s usually a sign that somebody big was trading there probably some
trading institution. The reason why those are important is that first, they are
footprints of somebody big, and second, price likes to react to heavy volumes.
So for example, if you take a look at this volume cluster, price moves away
from it and makes a pullback, and when it goes back to the area where this
volume cluster was formed, price reacts there. So it worked as a support,
right? Heavy volumes often work as strong supports and resistances. That’s why
volume clusters are important. They show significant supports and resistances
and the activity of the big guys.
Now I actually
like to look for volume clusters on this type of chart. It is a footprint chart
which shows total volumes, which means bid plus ask. The previous chart was
showing bid and ask separately, but this one is showing the total bid plus ask.
For me, it’s easier to read and easier to spot those heavy-volume zones. This
is the first one I was showing you. This is the second one I was showing you.
They simply stand out more visually. It’s easier for me to read the chart, so
that’s why I use this kind of chart to look for those volume clusters. If you
look at this example, then we have a rather significant volume cluster right
here. What it could represent is that when the price was dropping and reached
this place, maybe there was some support here, somebody big started to trade
here, heavy volumes were traded, and eventually this resulted in a change of
trend. It all happened around this significant volume cluster right here.
Again, I can show you this on that volume chart. In my opinion, it’s just better
visible there. This is that volume cluster that changed the direction of the
trend.
Now speaking of
the importance of heavy volumes, I also need to mention high-volume nodes.
There is a high-volume node in every footprint. My software draws a black
bracket around that high-volume node, and it’s the place where the heaviest
volumes were traded in each footprint. In each footprint there is a high-volume
node, and it shows where the heaviest volumes were traded in that particular
footprint. I’m not saying you need to trade every high-volume node you can see
on your chart, but it’s usually handy to know where the heaviest volumes were
traded in each footprint, especially if you have, for example, high-volume
nodes next to each other like in here. My software highlights that in yellow,
and it represents support or resistance. So for example, in here, there was a
pullback to this double high-volume node and the price reacted there. So you
want to keep track of the high-volume nodes as well because, as I was saying and
I’ll probably say it many times in this webinar heavy volumes are important.
Always keep track of heavy volumes.
Another very
important thing here is delta. Very simply put, delta is the difference between
buyers and sellers and shows who is stronger whether buyers or sellers. If
delta is positive, like for example in this footprint, that means buyers were
in control in this footprint. If delta is negative, like in here, then in this
footprint sellers were in control. Delta is ask (that’s the sum of those
volumes) minus bid (that’s the sum of those volumes), and my software prints
the delta below each footprint. So in each footprint you can tell who was in
control buyers or sellers. Needless to say, limit orders can mess things up.
They mess delta up. So it’s not the holy grail of all indicators. Otherwise it
probably would be, but it’s not because we have limit orders which can mess
things up. But still, I consider delta a very powerful tool and I always keep
track of it.
Speaking of
delta, I also like to use the cumulative delta, which is nothing else than how
delta was developing since the start of the day. If you look at this picture
here, then there’s a summary at the bottom of the screen showing the cumulative
delta. So the first footprint of the day was delta -62. The next delta is -10.
So -62 – 10 is -72. That’s the cumulative delta. It shows how delta was
developing since the start of the day. The next delta is positive, it is 12. So
-72 + 12 is -60. Now I must say this is quite challenging to keep track of if
it’s just numbers at the bottom of the screen. That’s why I use this chart.
It’s also cumulative delta, but in this case it is a simple line chart. It
shows the same thing how delta was developing since the start of the day. If
you look at it like this, it’s way easier to read. One simple look and you know
that cumulative delta is dropping and sellers are in control. Very simple and
very effective. I really like to use cumulative delta. I’ll show you how later.
By the way, my software also gives you the option to use this line chart of
cumulative delta rather than just the summary at the bottom. So if you get my
software, you’ll get this one as well. Very handy feature.
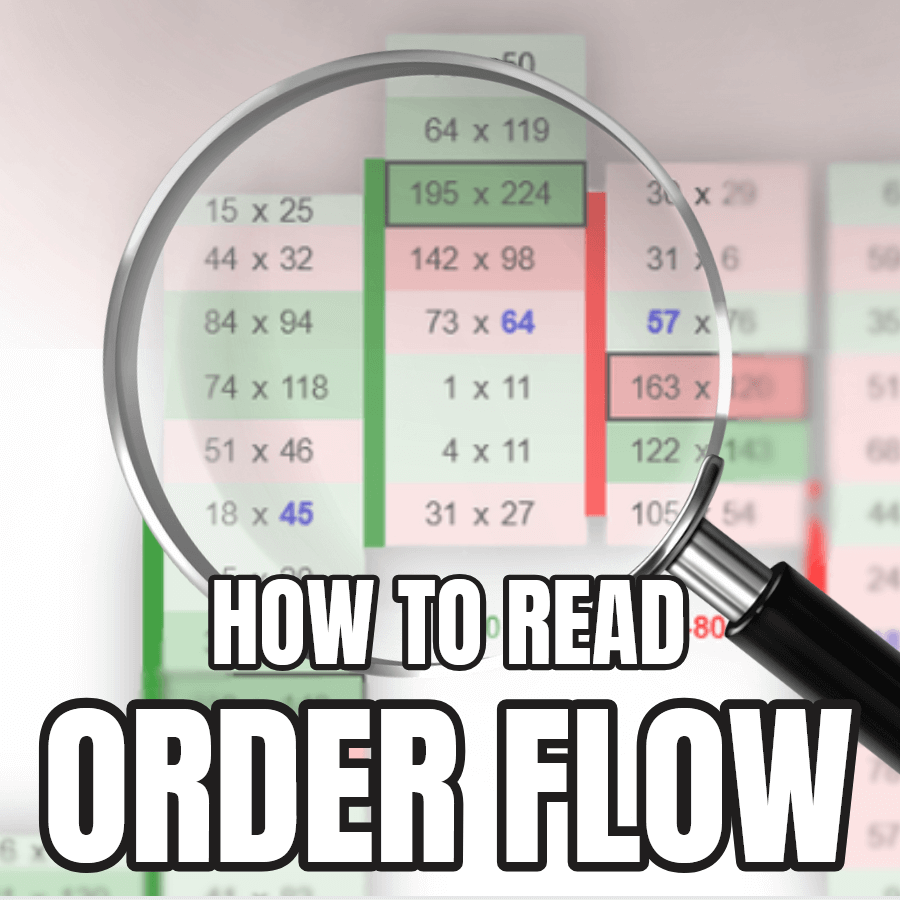
Another thing
that’s very important to keep track of is imbalances. An imbalance is when one
side of the market is way stronger than the other. For example, buyers were way
stronger than sellers or sellers way stronger than buyers. The definition of
“way stronger” is three times or more. So take a look at this footprint and
this number here, 313. It’s highlighted in blue. That means it is an imbalance.
My software highlights those so I can spot them easily. You always compare
diagonally that’s how you read order flow like this. You compare 313 to 96. If
313 is three times or more than 96, then it gets highlighted in blue and it
shows imbalance. Sellers were way more aggressive than buyers here. If we look
further in the chart, we have imbalance here, then imbalance here. Those are
selling imbalances because they are at bid. But there is, for example, a buying
imbalance right here. It shows at ask, which means buyers were in control here
because we are comparing 35 contracts and 108 contracts. So that’s why it gets
highlighted in blue because in here buyers were more aggressive. The way I use
those imbalances is I often look for stacked imbalances. A stacked imbalance is
when more imbalances are stacked on top of each other. In this footprint, you
see all those blue numbers those are imbalances. If they are stacked on top of
each other, then they are stacked imbalances and they often represent a strong
support or resistance zone, because this is a place where sellers in this case,
sellers were way more aggressive than buyers. My software highlights those
areas. For example, in here we have a stacked buying imbalance and it gets
highlighted like this and represents strong support. So if there is a pullback,
the price is likely to react there. This is how I like to trade imbalances,
especially the stacked imbalances. So remember, an imbalance or stacked
imbalance shows aggression and strength of either buyers or sellers.
As I was saying,
it is very important to keep track of what the big picture is, and for that I
like to use volume profile. Volume profile is that thing on the left side of
the screen, this histogram right here, and it is a daily profile which shows
how volumes were distributed through the whole day. One quick look and you know
there’s a significant volume zone here, another significant volume zone here,
light volumes here, light volumes here. This gives you the big picture, which
is so important when trading with order flow. I know order flow is all about
the details, but it only works if you know what’s going on in the bigger
picture. That’s why volume profile is so important and why it’s also part of my
order-flow software.
Now I’d like to
do a little summary of the things I showed you. There are a couple of them. So
right now, you can see all of them on one screen. And basically, if you open an
order-flow chart like this one, these are the things you should focus on and always
keep in mind. You should keep track of the volume profile where the heaviest
volumes are and what important areas in the chart are. You should keep track of
the heavy volume clusters. You should look for high-volume nodes like this one,
this one, this one. Then you should look for stacked imbalances like those. You
should look for multiple high-volume nodes like this one, this one, or this
one. You should keep track of delta below each footprint and also cumulative
delta. So if you open an order-flow chart, these should be the things that
stand out. Don’t try to read every single number on your screen. That won’t
help. You’ll just get lost in that matrix. Just read those things and the order
flow will start to make sense. It won’t be complex. You just need to know what
to look for, and these are the most important things.
Now at this
point, I’d like to show you my workspace. You can copy it, you can let it
inspire you. Here’s how it looks. On the top left, there’s a chart a 30-minute
chart showing total volumes. It’s not a bid-and-ask chart, only total volumes.
On this chart, I look at the bigger picture because it’s a 30-minute chart. I
look for significant volume clusters like this one. I look at the volume
profile. As I was saying, this is the bigger picture. Another chart that shows
the bigger picture is this one. It’s something I call the Trades Filter. It
only shows single trades that were bigger than X amount of contracts. So it
filters out all the noise and shows only the big orders. For example, here, one
order of 182 contracts. As you can see, in this case, this actually turned the
trend from downtrend to uptrend. So this is the Trades Filter. Very useful
feature. It also gives me a bigger-picture look.
Then on the
right side of the screen, there is this chart. This one gives me a more
detailed look because this is a bid-and-ask chart. It is a five-minute chart
and I use this one to look for order-flow setups, confirmation setups, and
nuances. I also use this one to look at deltas and all the stuff I’m going to
show you today regarding trade confirmations or other order-flow setups. So
this is the detailed look into bid and ask. And the last chart is this one.
It’s a combination of two charts. The first one is a one-minute chart of price,
and below that a one-minute chart of cumulative delta. I compare those and look
for divergences there. So this is how the order-flow workspace looks.
And in order not
to lose the bigger picture, I also have a volume-profile chart with simple
candles on my other screen. It looks like this. I have volume profile here,
which is a weekly volume profile. Then there’s a volume profile I can move
around like this that’s the flexible profile. I also have a weekly VWAP here.
By the way, this is a 30-minute chart. So this is the big picture. I look for
my levels here first, and then I trade those levels with order flow.
So that’s about
the workspace. By the way, if you’d like to join our trading community, you get
access to all these indicators, to the volume-profile indicators. We’ll install
everything for you, set everything up the workspaces, the data, the platform,
everything. If you want to join us, head over to my website, Trader-Dale.com. If you click Trading
Course and Tools, then it’ll take you to this page. Here you can browse my
education and indicator packs. This is the Order-Flow Pack, which includes a
12-hour course on order-flow trading, my order-flow software, and my
volume-profile software. You also get tech support, which will install
everything for you. There are also other packs you can get here the
Volume-Profile Pack, the VWAP Pack, the Smart-Money Pack. You can get them
separately here, or scroll down a bit and you can get all four together for a
discounted price.
Hello, please I have a question about your course, I mean the complete package, Orderflow, Volume profile, SMC and VWAP. Will these tools really be enough for me to trade profitably? Another question is. I don’t speak English. Are the lessons in some application or is it possible to put them in a translator? When I watch some videos on YouTube, I put a translator and subtitles. Is it possible to translate the course into Czech? Thank you