When most traders first open an order flow platform, they see a wall of numbers scrolling in real time and immediately close it. I get it — I had the same reaction in my early years. But order flow isn’t as complex as it looks once you understand what you’re actually looking at.
The numbers are just a record of who is buying and who is selling, and how aggressively they’re doing it. That’s it. Once you can read that, you’re no longer guessing where price might go — you’re reading the actual intent of the biggest players in the market.
In this article I’ll walk you through the key order flow concepts I use after 16 years of professional trading: Volume Clusters, High Volume Nodes, Delta, Cumulative Delta, Imbalances, and how to combine them with Volume Profile into a professional workspace.
Table of Contents
What are Volume Clusters and Why Do They Matter?
Standard candlestick charts show you the open, high, low, and close — but nothing about where the volume traded within that candle. Volume Clusters reveal exactly that: the specific price levels inside each candle where the most trading activity occurred.
Why does this matter? Because large institutions can’t hide their orders. When a bank needs to buy or sell tens of thousands of contracts, that activity leaves a visible footprint in the volume data. A heavy volume cluster at a specific price tells you: this is where serious money changed hands.
These clusters become reference points the market returns to. When price revisits a heavy volume zone, traders who were positioned there are still present — and their reactions (holding, adding, or exiting) create the support and resistance you see on the chart. You’re not looking at arbitrary lines; you’re looking at where real institutional capital is sitting.
Why are they important?
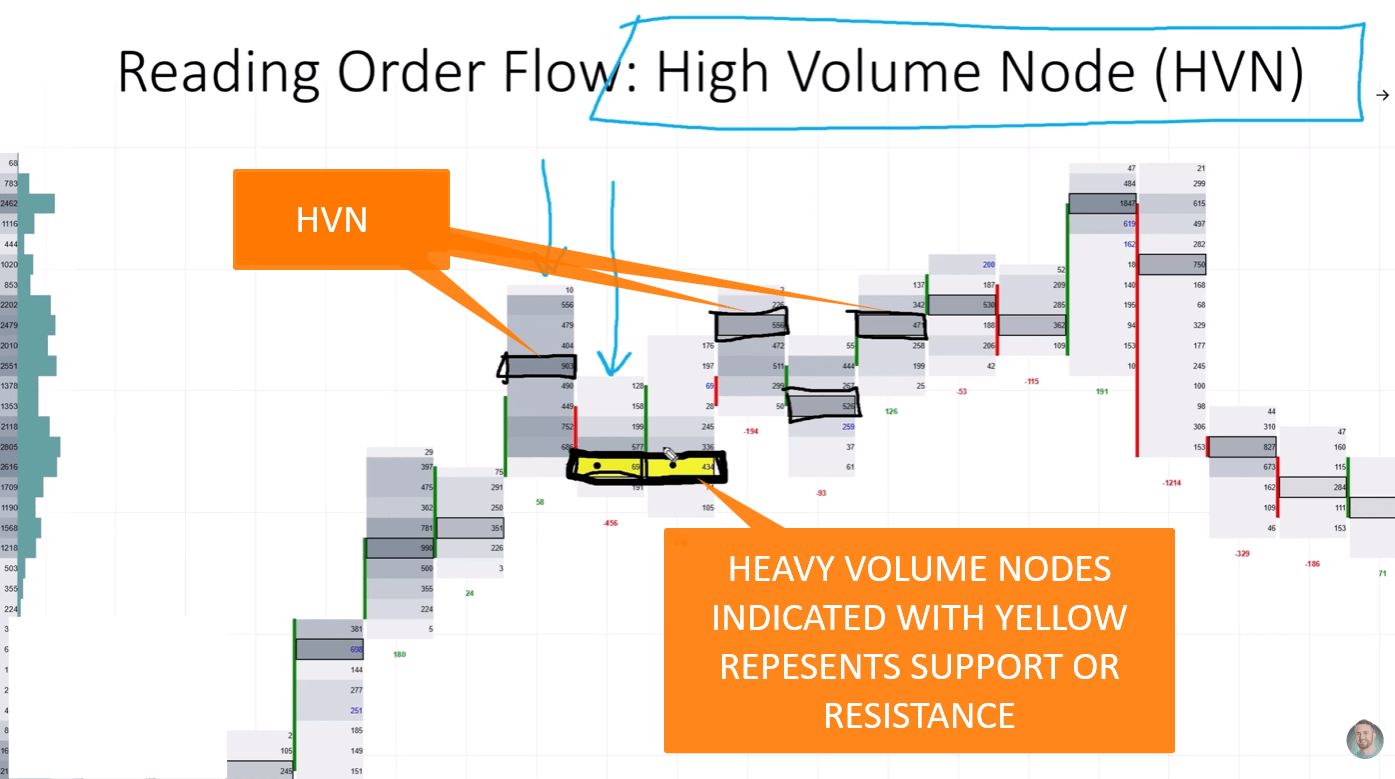
Within every footprint candle, the single price with the most activity is called the High Volume Node (HVN). In my software, HVNs are highlighted with a black bracket so they’re immediately visible without having to scan every row of data.
Think of a High Volume Node as a gravity well. Because the most contracts traded there, the market has a strong “memory” of that price. When a trend is moving and hits an HVN from a previous session, price typically pauses or rotates around that level before committing to the next move. It’s a speed bump built from actual trading activity, not a drawn line.
The most powerful setups happen when multiple HVNs from different candles align at the same price level — my software highlights these in yellow. When you see that yellow alignment forming across several candles, you’re looking at a structural level that has been “tested and confirmed” repeatedly. These are the levels I trade with the most confidence.

How to Use High-Volume Nodes as Support and Resistance?
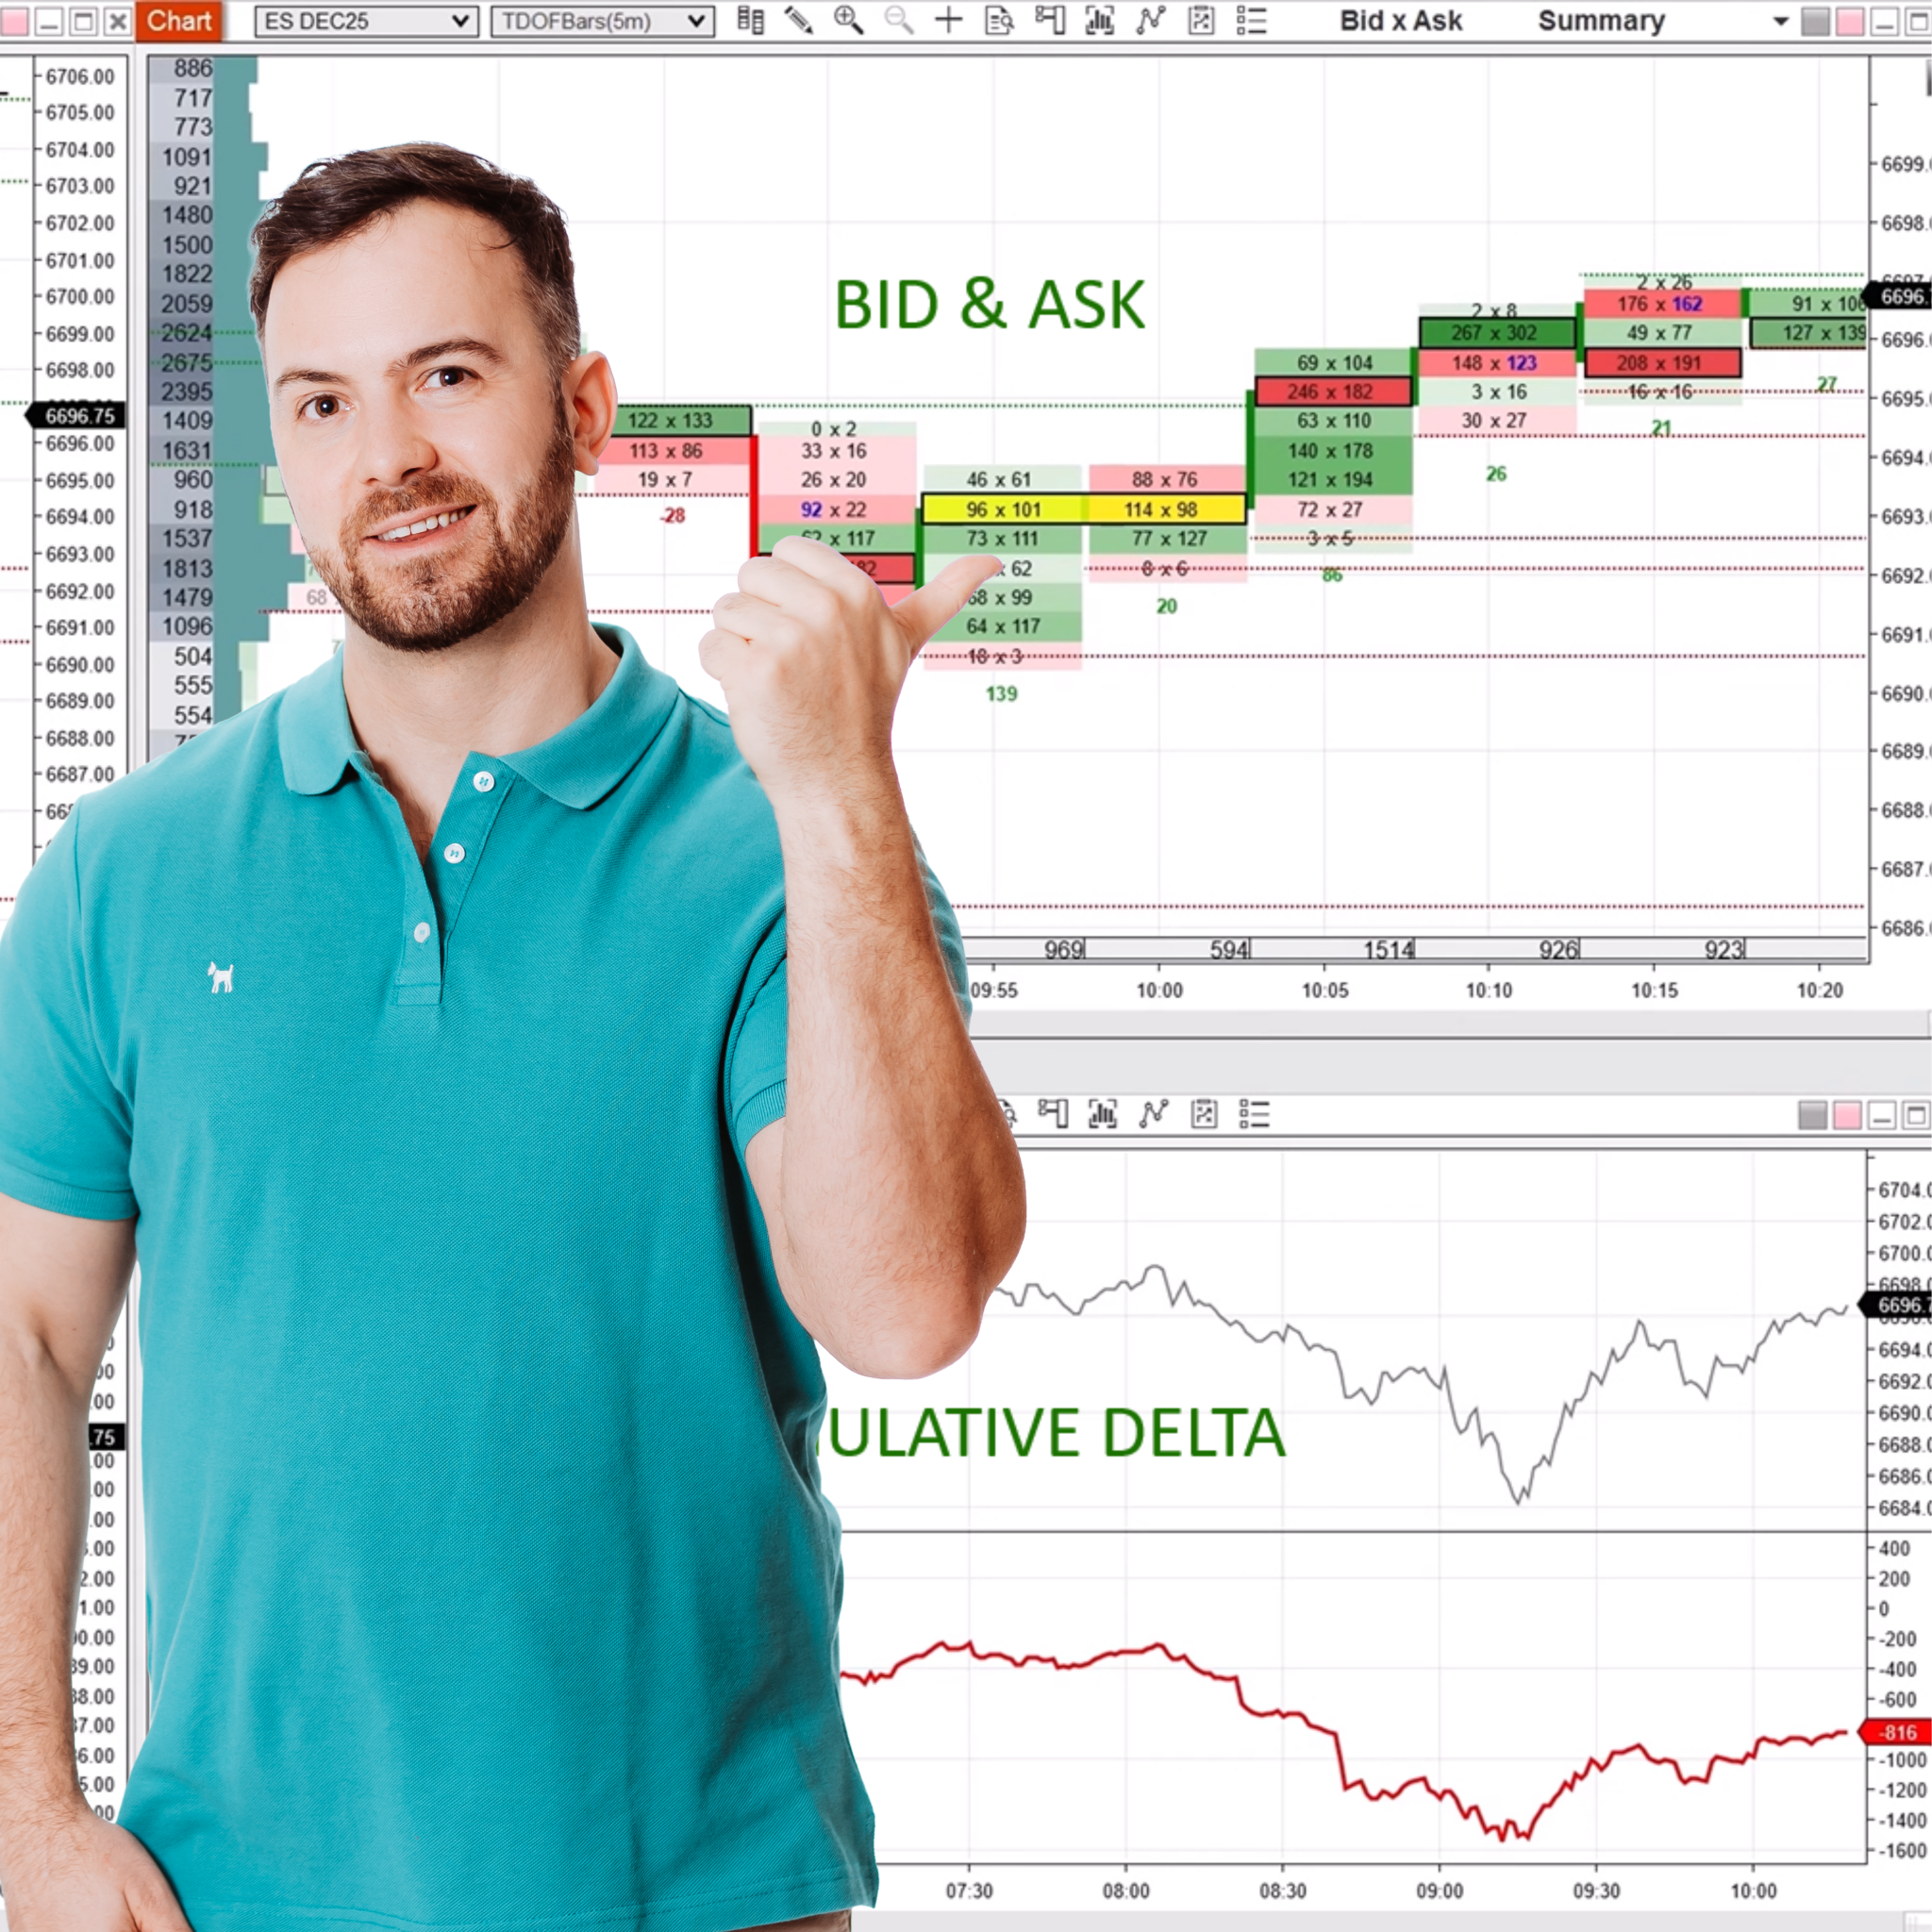
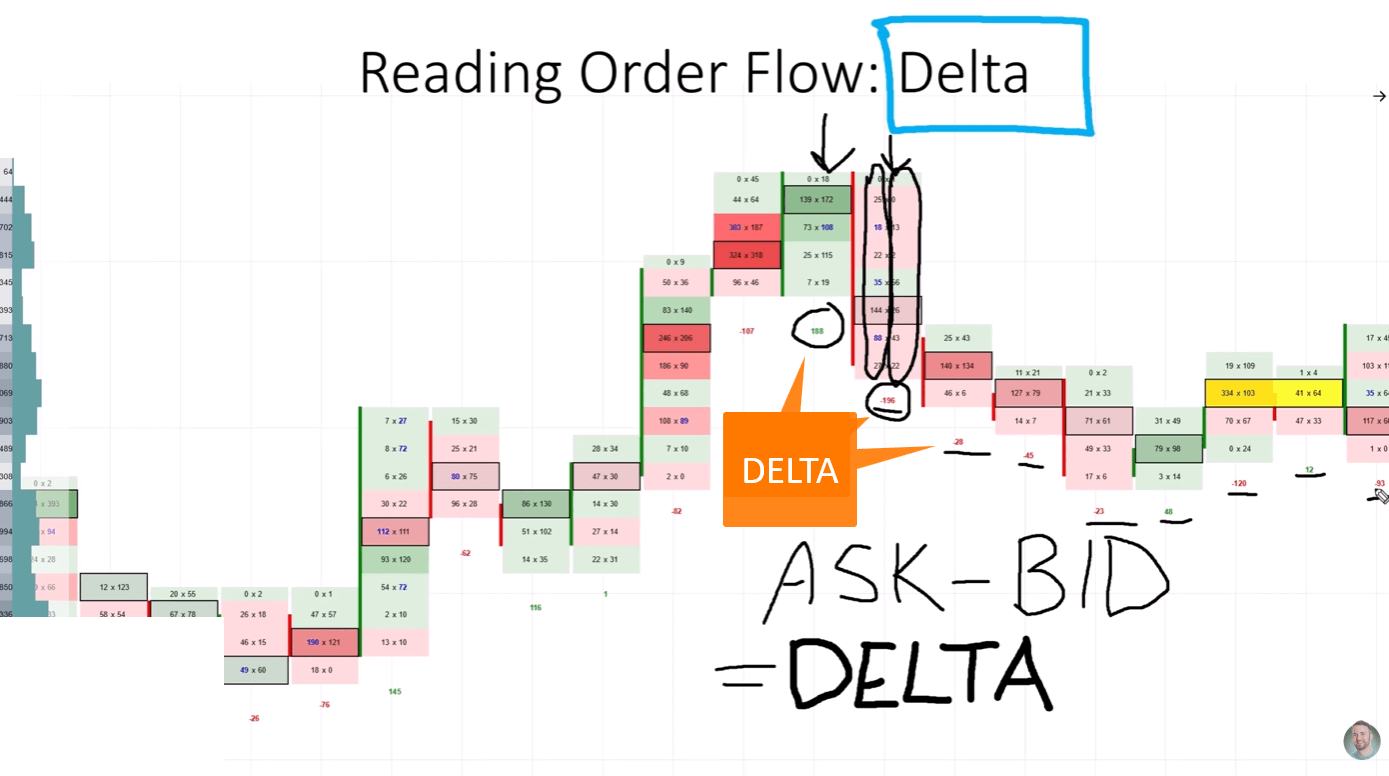
Delta tells you who is winning the battle between buyers and sellers in any given candle. It’s calculated as: Aggressive Buyers (market buy orders hitting the ask) minus Aggressive Sellers (market sell orders hitting the bid).
- Positive Delta: More buyers hit the market than sellers — buyers are more aggressive in that candle.
- Negative Delta: More sellers hit the market — sellers are driving price.
- Delta = Ask Volume minus Bid Volume
Delta for a single candle is useful context. But the real power comes when you track Delta across the entire session — that’s Cumulative Delta.
Understanding Delta and Cumulative Delta
Cumulative Delta adds up the Delta of every candle from the market open, giving you a running total of net aggression throughout the session. This is where the divergence signals come from — the same concept I cover in detail in the Cumulative Delta article.
The key use here: divergence between price and Cumulative Delta is one of the highest-probability reversal signals in all of order flow trading. If price is making a new high but Cumulative Delta is making a lower high, aggressive selling is increasing even as price rises — the move is exhausting itself. A reversal is likely imminent.
I display Cumulative Delta as a line chart on a separate panel synced with my price chart. One glance tells me whether the buying or selling aggression is building or fading. If price and Delta are both moving in the same direction, the trend has conviction. If they diverge, I’m looking for the reversal trade.
The Truth Filter: Cumulative Delta
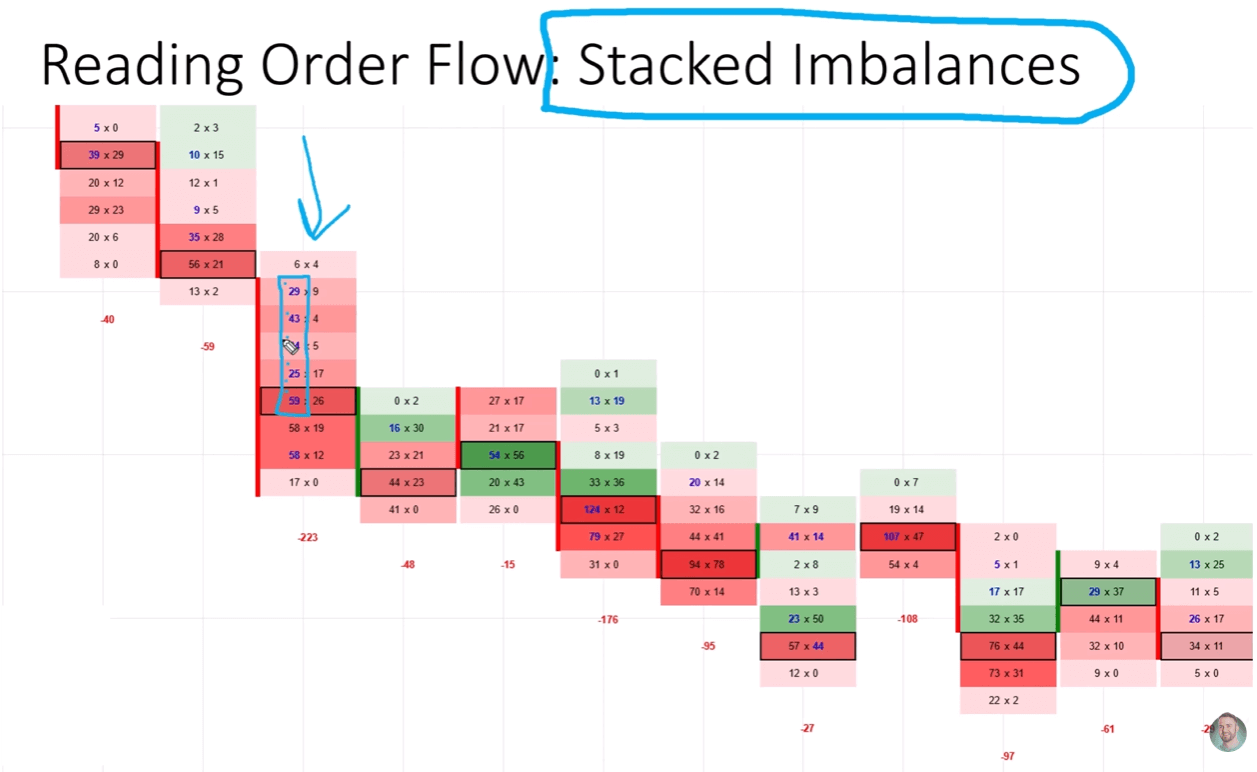
An Imbalance occurs when one side of the market is dramatically more aggressive than the other at a specific price level. In my setup, I define “dramatically” as 3x or more — when the buying volume is at least 300% of the selling volume (or vice versa) on a diagonal comparison within the footprint.
When this happens, the software highlights it: blue for buying imbalances, red for selling imbalances. A single imbalance is interesting. But Stacked Imbalances — three or more consecutive imbalances in the same direction at adjacent price levels — are significant.
Stacked buying imbalances show where aggressive institutional buyers hit the market repeatedly at similar prices. When price later returns to that zone, those buyers are likely to defend their position. It acts as a strong support level because the aggression that created it was real and large-scale. Stacked selling imbalances work the same way as resistance.
I use imbalances as confirmation tools. An imbalance zone at a Volume Profile support level is a much stronger setup than either signal alone.

Spotting Market Aggression with Imbalances
An imbalance happens when one side of the market is significantly stronger than the other. In my setup, we define “way stronger” as three times (300%) or more. We compare the numbers diagonally. If the buying side is 3x larger than the selling side at the next price level, the software highlights it in blue.

The real magic happens with Stacked Imbalances. This is when three or more imbalances appear right on top of each other. This represents extreme aggression. When a big group of sellers hammers the market in one spot, that area becomes a “zone of interest.” If price returns to a stacked buying imbalance, expect it to act as a strong support level. It shows you exactly where the “big guys” were most aggressive.
The Power of the Volume Profile
Order flow gives you the micro-level detail — what happened inside each candle. But you need the Volume Profile to see the macro-level structure of the market.
The Volume Profile is a horizontal histogram showing the total volume traded at each price level over a given period. High-volume areas (High Volume Nodes) are where the market spent the most time and established “fair value.” Low-volume areas are where price moved quickly — these are rejection zones that price tends to shoot through without holding.
My workflow is always the same: Volume Profile first to identify the key levels, then Order Flow to zoom in and confirm whether institutional activity is present at those levels before I enter. The Volume Profile gives me the map. Order flow gives me the real-time X-ray at those key map coordinates.
Trading in high-volume areas is like fighting against a wall of institutional orders. Trading through low-volume areas is like the market running on an open highway. Knowing which is which keeps you out of the choppy zones and focused on the high-probability reactions.

How to Build Your Professional Order Flow Workspace
The single biggest mistake beginners make with order flow is trying to read everything at once. The data is dense — if you try to track every number on the footprint chart simultaneously, you’ll freeze up and miss the trade. The solution is a clean, purpose-built workspace where each chart has a specific job.
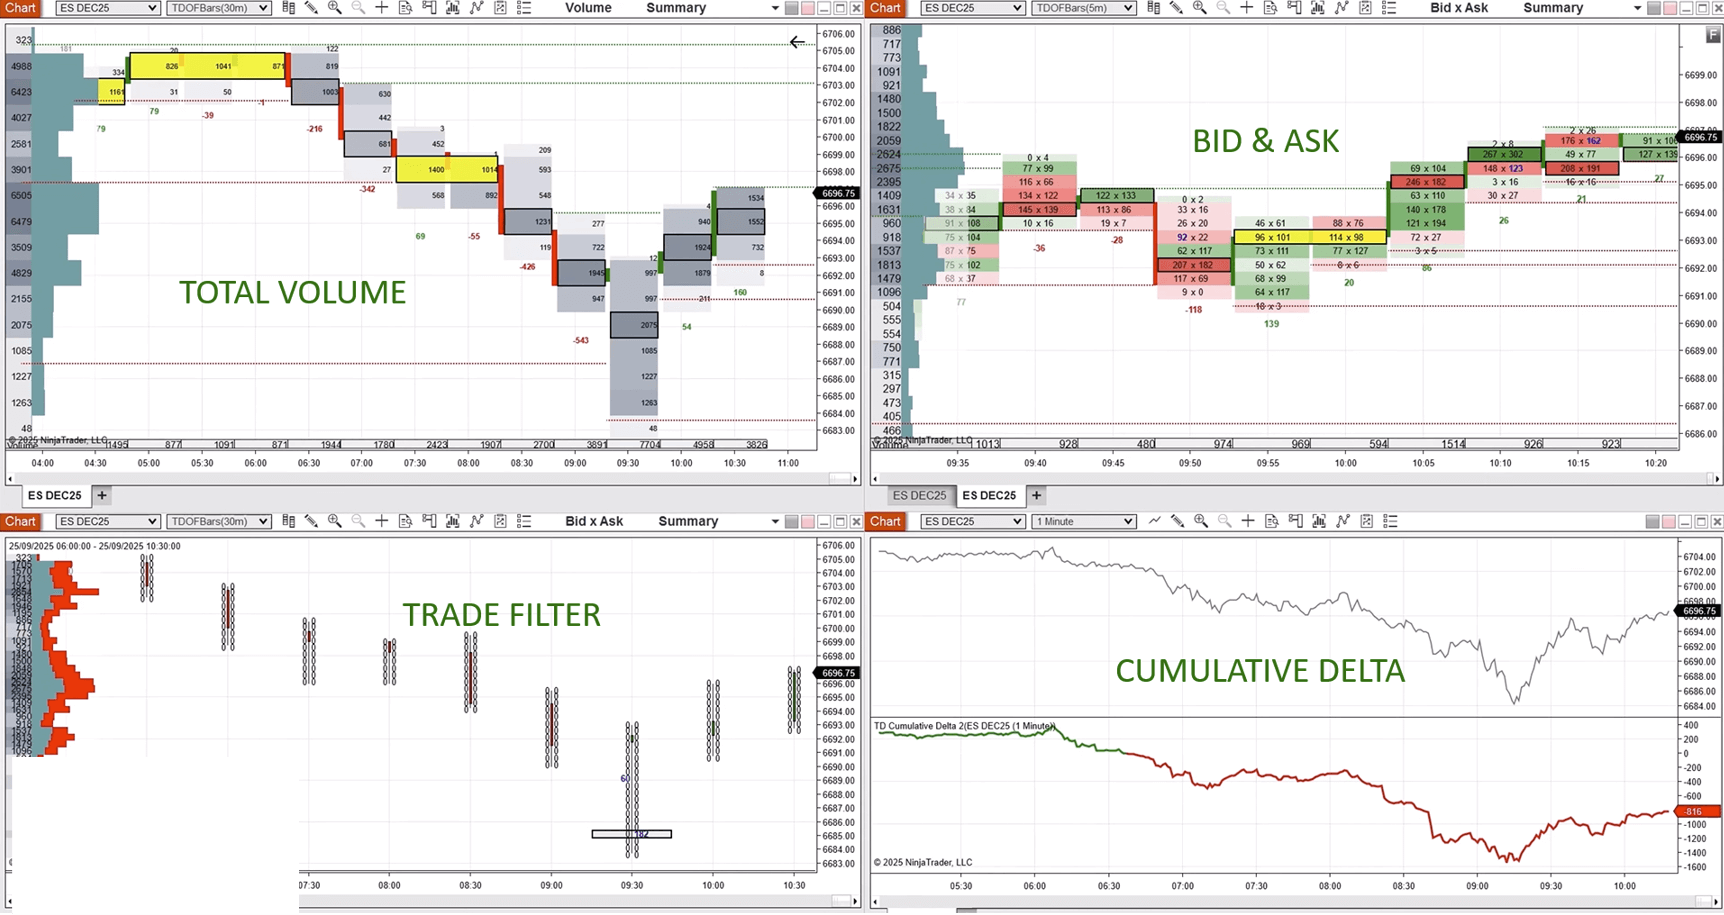
Here’s the setup I use and teach:
- 30-Minute Total Volume Chart: Shows the major Volume Clusters for the session. This is where I identify the key levels and zones I want to watch.
- 30-Minute Trades Filter: Filters out small retail orders and only shows large institutional trades. This strips the noise and lets you see the “big fish” activity clearly.
- 5-Minute Bid/Ask Footprint: The detailed execution view. This is where I watch for imbalances, HVN alignment, and Delta to confirm entries at the levels I’ve identified on the higher timeframe.
- 1-Minute Cumulative Delta: Synced with the footprint chart. I use this to catch divergences and confirm or deny the trend strength at my entry levels.
Each chart has a specific job. You’re not trying to read all of them at the same time — you’re moving your attention sequentially: big picture levels first, then zoom into the footprint for entry confirmation, with Delta as your ongoing trend filter.
The "Big Picture" Screen
On a second monitor I keep a Weekly Volume Profile and the Daily VWAP. This gives me the broader context that the intraday order flow charts can’t show. I identify my key structural levels on this big picture chart first — major weekly High Volume Nodes and VWAP fair value — and then use the order flow charts to execute precisely within those levels.
The Trades Filter on the 30-minute chart is particularly powerful here. By setting a minimum order size threshold, you filter out the noise of small retail trades and only display the large institutional prints that actually move markets. When you see a 500-contract market buy at a key level, that tells you something that 5,000 individual 1-lot orders would not.
Conclusion: Stop Guessing and Start Reading
Order flow stops being intimidating the moment you realise it’s just showing you two things: where the volume concentrated, and how aggressively buyers or sellers were participating. Everything else — HVNs, Delta, imbalances — is a refinement of those two core ideas.
Start with Volume Clusters. Learn to see the zones where institutional money gathered. Then add Cumulative Delta to understand the directional pressure behind price moves. Then layer in imbalances to find the spots of extreme aggression. Finally, use the Volume Profile as your map to know which price levels matter most.
Each layer adds precision to your entries and confidence to your decisions. Once you’ve built the workspace and traded from it for a few weeks, you’ll find it hard to go back to reading plain candle charts.
If you want to see all of these concepts applied on live charts with real trade examples, the video above is a full walkthrough — including the complete workspace setup at 13:28. And if you want to go deeper, my complete order flow course and tools covers every component in detail with real trade walkthroughs.
Frequently Asked Questions (FAQ)
Here are the most common questions I get about order flow trading:
In practical terms, it means looking inside each price candle to see the actual buy and sell orders that were executed at each price level — rather than just seeing the candle’s open, high, low, and close. A footprint chart (the primary order flow tool) shows you the volume of aggressive buy orders vs. aggressive sell orders at every price level within the candle. This lets you see things a standard chart can’t show: where large buyers absorbed selling pressure, where sellers stepped in to stop a rally, and when the momentum behind a move is running out. It’s the difference between watching a scoreboard and watching the actual game.
You can, but with an important caveat. Spot Forex is decentralised — there’s no central exchange capturing every trade globally. The “volume” data you see on a spot Forex chart is tick volume (a count of price changes), not actual contract data. For proper order flow, you need centralised futures data. Most Forex traders who use real order flow trade the 6E (Euro Futures) or 6A (AUD Futures) on the CME, which move almost identically to their spot counterparts but with real bid/ask data.
You need a platform that supports footprint charts and Level 1 tick data — NinjaTrader, Sierra Chart, or QuantTower are the main options. You also need a quality data feed (Rithmic or CQG) to ensure every tick from the exchange is captured. Free platforms like TradingView don’t provide real Cumulative Delta or footprint data — they use tick count, which is a much less reliable signal.
Most traders get comfortable reading the basic signals — Volume Clusters, HVN alignment, and clear Cumulative Delta divergences — within 4 to 8 weeks of consistent screen time. The key is not trying to read everything at once. Start with just Volume Clusters on a 30-minute chart. Once that feels natural, add Cumulative Delta. Build the skill layer by layer rather than trying to absorb everything simultaneously.
A standard candlestick shows you four data points per candle: open, high, low, and close. A footprint chart shows you the volume traded at every single price level inside that candle, split by buy volume (aggressive buyers) and sell volume (aggressive sellers). You can see exactly where within the candle the most activity happened, whether buyers or sellers were more aggressive at each level, and where imbalances formed. It’s the difference between knowing a trade happened and knowing exactly how it happened.
Absorption happens when large orders on one side are met by even larger orders on the opposite side — and price doesn’t move despite the pressure. For example: a heavy wave of buy orders hits the market, but price barely moves higher. That means a big seller is absorbing all the buying. The absorbed side (buyers in this case) will eventually exhaust, and when they do, price drops sharply. Absorption is one of the most reliable signals in order flow because it tells you that a major player is positioned against the visible direction of flow — and they’re winning. Spotting absorption at a Volume Profile node is particularly powerful.