
I am a little reluctant to put this up simply as I am aware of the dangers of optimization, and despite all warnings I know that some folks will always try to optimize. I’d really caution against doing so as in 1 months’ time the optimal level is likely to be somewhere else, but at the same time we can use available data to find a “sweet spot” area.
First I should explain that my data is not “3D”, it is 2 dimensional only. The way I record my data is as follows.
- I record how far against the level price goes before getting 10 pips up, and then how much further it goes before coming back to the level.
- I record how far against the level price gets before getting 20 pips up, and then how much further it gets before coming back to the level.
So I can say how Dales levels have performed so far on the basis of moving the stop to BE once 10 pips up, & I can say how it’s performed versus a 20 pip PT – and I can do both of these things at various stop levels.
As I always try to remind, my data is either it does or it doesn’t and pays no regard to any actions that might be taken mid trade.
So is it better to leave a trade alone or to move stops, well there is a lot written about moving stops and basically if you do you are trading your P&L rather than the trade itself, & on every test of every approach I’ve ever looked at you get “better” results leaving your stop alone and letting the trade play out – but having said that we are all human and who is going to let a trade that is way in front come back and take you out for a loss. Certainly I don’t even though I “know” the best approach is to leave it alone.
So here is a table that shows the results of various stop & PT levels on the basis of moving the stop to break-even once a trade has got itself 10 pips in front. Now spread is massively important, as what is +10 for me may not be for you – these are the spread levels I have applied, and I promise you if your spreads are worse than this it can have BIG impact on the results. EU 0.7, AU 0.8, UJ 0.7, UC 1.0. Certainly in the UK there is no reason to accept worse spreads, I have no idea about other countries.
| Stop | PT | 10 | 12 | 14 | 16 | 18 | 20 | 22 | 24 | 26 |
| 10 | 230 | 318 | 398 | 430 | 468 | 450 | 392 | 438 | 416 | |
| 11 | 302 | 396 | 478 | 524 | 576 | 552 | 462 | 516 | 502 | |
| 12 | 304 | 408 | 472 | 524 | 582 | 516 | 458 | 516 | 506 | |
| 13 | 385 | 493 | 571 | 621 | 691 | 665 | 591 | 613 | 585 | |
| 14 | 410 | 516 | 588 | 644 | 720 | 700 | 588 | 612 | 586 | |
| 15 | 470 | 588 | 672 | 740 | 828 | 800 | 676 | 708 | 690 | |
| 16 | 542 | 660 | 754 | 832 | 930 | 912 | 798 | 840 | 832 | |
| 17 | 653 | 761 | 865 | 953 | 1061 | 1053 | 949 | 1001 | 1003 | |
| 18 | 638 | 750 | 844 | 934 | 1044 | 1038 | 936 | 990 | 994 | |
| 19 | 627 | 743 | 841 | 935 | 1049 | 1047 | 949 | 1007 | 989 | |
| 20 | 680 | 792 | 882 | 980 | 1080 | 1060 | 962 | 1020 | 1002 | |
| 21 | 741 | 861 | 945 | 1049 | 1137 | 1101 | 1005 | 1065 | 1049 | |
| 22 | 714 | 836 | 922 | 1028 | 1100 | 1064 | 968 | 1028 | 1012 | |
| 23 | 689 | 813 | 901 | 1009 | 1083 | 1049 | 955 | 1017 | 1003 | |
| 24 | 632 | 756 | 844 | 952 | 1026 | 992 | 898 | 960 | 946 | |
| 25 | 610 | 801 | 812 | 920 | 994 | 960 | 866 | 928 | 914 | |
| 26 | 662 | 782 | 876 | 990 | 1070 | 1042 | 854 | 1022 | 1014 |
So to be clear about what this table is showing, the stop level is down the left, the PT level across the top, and if the trade gets to +10 the stop is moved to break even, so trading with a 15 pip stop, moving your stop to BE at +10 and going for 20 pips PT gives a total of 800 pips. Just to reinforce the spread issue, if your spread is worse you can get stopped out earlier, it will take you longer to get to +10, once there you can be taken out at BE earlier, and you may not actually reach the PT level, bad spreads hurt on so many levels.
Anyway, what you can see is that the “best” PT levels are constantly in the 16-20 region no matter what stop level is applied, and the “best” stop level is constantly in the 17-23 region no matter what PT is applied. On current information this box gives us a sweet spot area.
Now that in itself isn’t the whole story as we wouldn’t want a situation where all the profit is made during a purple patch and the rest of the time it does nothing. Short of me posting up hundreds of charts you’ll have to take my word on how it looks, and anywhere in that sweet spot range I mentioned is ok – but you still have to accept ups, downs, & sideways in the results.
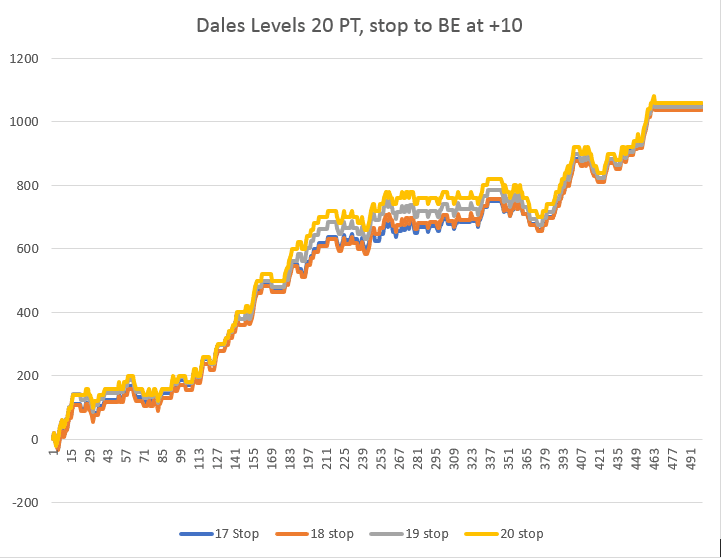
So, I’ll give you a graph using a 20 pip PT with various stops applied – all with moving the stop to BE at +10.
 *Results were generated using a Simulated Trading Account and are Hypothetical.
As you can see not much in it, a bit of a flat spot in the middle but pretty damn good. That flat line at the end is coz I have the calcs set in my spreadsheet waiting for new data.
So I mentioned that in terms of pips performance it is generally better not to move your stops. And this is a chart comparing a 20 stop, 20 PT with & without moving the stop to BE, but there are other things to consider – like how often you actually lose. Obviously at 20/20 it’s win or lose, except to say if all that stops me from making a PT is spread I will move my stop to anywhere between +5 and +10.
By leaving the stop unchanged the win rate is running at 63%, so 37% lose rate, by moving the stop to BE at +10 the win rate drops to 45%, but 31% BE and only 24% lose. That may be psychologically important to you.
 Results were generated using a Simulated Trading Account and are Hypothetical.
In terms of drawdown there isn’t a great difference, but of course the sample size isn’t that great, 2 charts below.


How you use this information is up to you, I can tell you I trade with a 20 pip stop & 20 pip PT and generally don’t move my stop unless it is only my spread that has prevented me getting a TP. I do however take heed of pending news & if I’m in profit prior to the news I tend to either bank it or move my stop so that I’ll at worst come away with BE.
I personally believe that you have to find a way of trading that suits your own needs / personality – there is no point in changing what you do after a losing period, because this approach does work very well – for us retail traders it is hard to make an income from FX, I am totally convinced that by adopting a consistent approach to Dales levels is key.
-Ziggy
Excellent Ziggy, thanks for sharing. Thanks to Dale as well for helping to make this information available.
Ziggy and Dale,
Thanks for sharing this information. Ziggy I am impressed by the thoroughness of your comparisons. Well done.
My gut feeling had been that a 20 pip PT was highly probable but I am too lazy to do the work and not bright enough to set up parameters as you have done.
Ziggy, you inspire me to do “the work” when I have an idea. There is nothing stronger than hard data.
Thanks again and Great Job Well Done
Krek
The Graph titled: 20 PT Comparison, what is the Y-Axis number (0-1600) referring to? Is it profit? If so, wouldl’t BE+10 makes more sense?
Yes Y is profit in pips. You can ask Ziggy about this in the members forum. I am sure he will elaborate.