Just yesterday I was talking to my friend from the US and I was telling him that it would be best for them to just stop all intercontinental flights.
It is pretty funny because when I woke up today I saw this

I would like to say that this friend of mine was not Donald Trump but still it seems he also got this idea 🙂
All travel from Europe to US suspended
This step is in my opinion a good precaution to stop the corona virus from spreading across the globe. But what does this mean for the US economy? A severe blow! Bringing a big industry like intercontinental airlines to a 30 day halt will have economical consequences. Also it is not just this industry but also all the industries that are somehow linked to airlines.
I was not surprised when I saw the biggest US stock index S&P 500 drop after this news.
What does the current selling on S&P 500 mean for us traders? In my opinion this is an opportunity. US economy is strong and nothing like this could bring it to it’s knees. Also, a pullback after years of a crazy strong uptrend is a healthy thing for the market.
S&P 500 discounted
I like to talk about investment assets as if they were regular stuff you buy in a store. Imagine that you go shopping and the same thing which was $30 yesterday is now $20. It is the same thing as yesterday, same quality, same manufacturer. What does a reasonable person do? He buys all he can carry and store, right? Because the stuff is discounted!
We can apply the same approach to S&P 500. Pullback in S&P chart means a discount. In my opinion S&P 500 is a “good quality product that won’t spoil”. So the only question is how big the pullback needs to be before S&P gets real cheap and the big guys start pushing the price upwards again.
Do you want ME to help YOU with your trading?
Volume Profile analysis
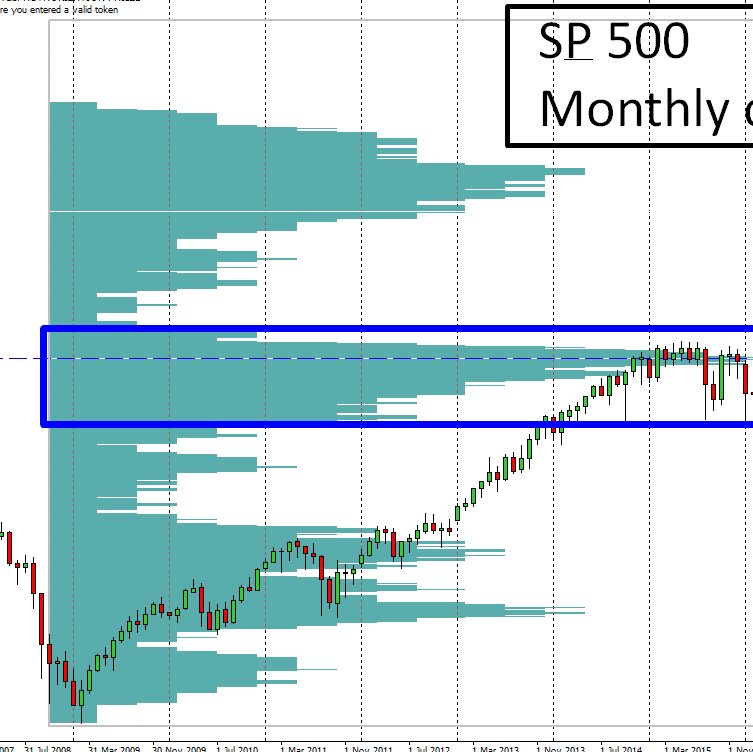
The best tool to uncover the strongest institutional supports and resistances is the Volume Profile. I opened a monthly chart of S&P 500 and looked 12 years back to see how the volumes were distributed in this whole period. This is the sort of BIG picture you want to examine when thinking over long-term trades.
The heaviest volumes in this 12 year period were accumulated between years 2014 and 2016 around 2070.00. From there a strong buying activity started again.
When there is a pullback big enough to hit this significant Volume Cluster sometime in the future then I think aggressive buyers will come into the market again and they will start buying like crazy. This should move the price upwards again.

As you can see from the picture above, the price is currently at another significant Volume Cluster. This could also prove to be a strong support and turn the price upwards again. But if you want to buy with a real BIG discount, then 2070.00 is the place I would picked for a big buy.
Long-term investment
With this kind of trade you need to treat it like a very long-term investment.This is not swing trade you hold for a few days and then get rid of it. This is a position to hold for a couple of years.
With such a kind of an investment you need to think about it like this: First the asset needs to be good. You need to like the S&P 500 and you need to believe in it. You need to believe in the US economy. Only then you should check out the chart and look for a place where you would like to buy it.
I hope you guys liked this S&P 500 analysis. Let me know what you think in the comments below!
Happy trading,
-Dale
Recommended Forex Broker
PS. Remember that this is not a trading recommendation, only my opinion. You guys should make your own mind about what to trade and how to trade it.
Thanks TD ! I have seen these long term high volume nodes ( VPOC’s) cause
violent reversals… They can be a very solid form of support !! I read once (
Bo Yoder, Optimize Your Trading Edge) that “markets seek out pools of liquidity”..
and this is a great example !