
Do you prefer a video? Check this out:
This article is a part of a four-part Beginners Guide to Volume Profile. Here are links to all four parts:
VOLUME PROFILE DEFINITION: Volume Profile is a trading indicator which shows Volume at Price. It helps to identify where the big financial institutions put their money and helps to reveal their intentions.
What does Volume Profile look like?
Volume Profile can have many shapes – depending on how the volumes were distributed. It is created using horizontal lines (it is a histogram). The thicker the profile is, the more volume was traded at the given level. If a profile is thin in some place, then it means that there was not a great deal of volume traded there.
Here is an example of how Volume Profile can look.


How is Volume Profile different from standard Volume indicator's on MT4?
Volume Profile shows volume at price. Standard volume indicator from MT4 (or any other software) shows volume during a specific time period.
There is a big difference!
Volume Profile shows you what price levels are important for the big trading institutions. Therefore, it points you to strong support and resistance zones.
Standard volume indicators only show you WHEN there were big volumes traded. This tells you nothing about important price levels (support/resistance zones).

What does Volume Profile tell us?
Let me demonstrate with an example:
In the picture below, you can see two heavy volume zones, and one zone where the Volume Profile is thin.
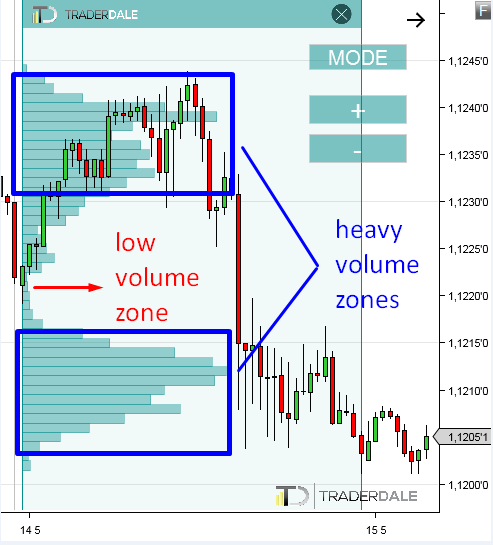
What does this particular picture tell us? It tells us that that big financial institutions were interested in trading in those two heavy volume zones. On the other hand, they did not really care for trading too much in the middle where volume was clearly thin.
This scenario could be a sign that big institutions were:
1) Building up their big selling positions in the heavy volume zone (1.1230 -1.1240).
2)Then they manipulated the price to go into a sell-off (that’s the thin profile).
3) And finally, they quit their positions (or were adding to them) in the heavy volume zone around 1.1205-1.1215.
Do you want ME to help YOU with your trading?
Different Volume Profile shapes
There are many shapes Volume Profile histogram can print and many different stories it can tell. However, the shapes and the stories behind them tend to repeat themselves and in the end, it comes down to just a few basic shapes the Volume Profile can take:
1) D-shaped Profile
Corresponds with a letter “D” and it is the most common shape. It tells us, that there is temporary balance in the market. Big financial institutions are building-up their trading positions and they are getting ready for a big move.

2) P-shaped Profile
Corresponds with a letter “P” and it is a sign of an uptrend. Aggressive institutional buyers were pushing the price upwards. Then the price found a fair value and a rotation started. In this rotation heavy volumes are traded and market is getting ready for a next big move. P-shaped Profiles are usually seen in an uptrend or in the end of a downtrend.

3) b-shaped Profile
Corresponds with the letter “b” and it is the exact opposite of P-shaped profile.
b-shaped profiles are usually seen in a downtrend or at the end of an uptrend.

4) Thin Profile
Corresponds with the letter “I” (with little bumps in it).
Thin profile means a strong trend. There is not much time for building-up trading positions in an aggressive price movement. Only small Volume Clusters are created in this kind of profile.
One of my favorite trading strategies is based on those Volume Clusters!


What makes Volume Profile different to other trading indicators?
No other indicator can show you where the big trading institutions were likely buying/selling like Volume Profile can! Why? 99% of all standard indicators are calculated only from two variables: Price and Time. Volume Profile gets calculated using three variables – Price, Time and Volume.
In other words – 99% of standard trading indicators only show you how the price was moving in the past. The only difference between those thousands of indicators is how they visualize it. It does not matter whether it is EMA, Bollinger bands, RSI, MACD, or any other indicator… All those only show a different visualization of a price movement in the past (they are delayed – they visualize something that has already happened).
YES – they are pretty useless which is the reason traders keep jumping from one to the other.
Volume Profile, on the other hand, points you to zones which were and will be important for big trading institutions. Simply put – Volume Profile can show you what will happen in the future!
Why should we care about volumes and what the big institutions are doing in the market?
We need to know what the big financial institutions are up to for one simple reason. They dominate, move and manipulate the markets. It is them who decide where the price will go, not you or I. We are too small.
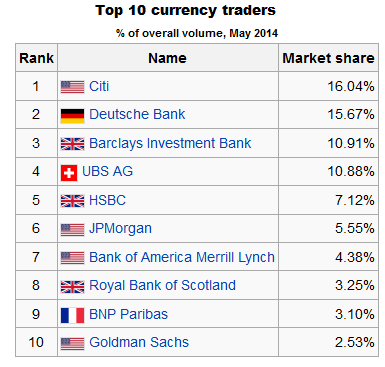
Have a look at the picture below. It shows 10 biggest banks and how much volume they control. Together it is almost 80% of the market. Just 10 banks!
It is those guys who own this game. Those are the guys we need to track and follow. And how do we follow them? By using Volume Profile to track their volumes.
Are there any simple Volume Profile strategies I can learn?
Yes, there are! They are based on the Volume Profile shapes I have already shown you. There is a separate guide where I show you step-by-step my favorite Volume Profile strategies.
You can learn the strategies here: Volume Profile Trading Strategies
I want an in-depth Volume Profile Education and training!
Congratulations! You are on the best place for that! I have designed unique Volume Profile educational courses, that will teach you all there is about Volume Profile!
You can chose the best fitting course here:
Dale’s Volume Profile Training
Happy trading!
-Dale
Continue reading to Part 2 here:
Beginners Guide to Volume Profile Part 2: Simple Volume Profile Trading Setups
Will this volume profile works on futures?
Absolutely!! It is great with futures.
Estoy con NT8 en Simulated y queria saber si todos los indicadores sirven para NT8 para Futurs (GC,CL,ES,NQ,Ect..) y si todos los datos son en Real Time,sobretodo el de volumen,cuales son los indicadores que mejor funcionan para NT8,gracias.
Hello, you can use all my indicators for those symbols you listed. They will work really nicely with them. All the data is in real-time even if you use the trial NT mode.
Hi there, in your opinion, and maybe also statistically spoken, how often did your P-profile continue its uptrend? I read your book and found few explanations too generic and often in the world of trading, generally everything is a) subjective and b) generic as otherwise we would be having cocktails in Jamaica.
However, could you elaborate a bit more on the P-profile coz’ on a first glance, it generally looks like a great shorting opportunity (maybe just a decent retracement) although due to the heavy pressure/aggresiveness from buyers, they might prevent the price from dropping and thus little you can short there. But if it drops, it drops like a cliffhanger.
Hello Gordon,
I am sorry I don’t have hard numbers on how often P shaped profile is followed by uptrend. You know P shaped profile occurs in an uptrend but also at the end of a downtrend. So it could also help you to determine the end of a trend.
But if there is currently an uptrend and new P shaped profile gets formed, and also the price closes the day above 50% of its range, then it is likely that the uptrend will continue. In other words – buyers pushed the price upwards and the market accepted higher prices as a fair value.
I hope this makes sense and I will see you soon having drinks in Jamaica 🙂
Is this volume indicator free?
How can I download it from please ?
Kind regards,
Victor Matthew Ayegba
Hi Victor, It’s not free. You can get it here on my website after clicking at ”trading course & tools” at the top menu bar.
Hello sir,
Is volume profile work in option segment ?
Hello, yes you can use it for options as well.
where i can get volume profile indictor i downlaoded 1 but it not showing on chahrt
Hi buddy, it needs to be purchased first here on the website under ”trading course & tools”. After that you send me your machine ID so I can authorize it.
In tradingview it’s freely available. Got to tools section and find out anchorer volume profile
Hi, Dale
Are your courses available in any time i get a chance to learn?
Does the Volume profile help me trade profitable with out using trend lines or support/Resistance Zones?
Hi Bubba, of course they are. It does, but I like to add the basic price action to it as well for even better results.
What is the winning rate by using your strategy to trade?
Hello, around 65-70% in the long run with RRR=1.
-Dale
do you have a trial version for mt4 ?
Of course! Just shot me an email request at contact@trader-dale.com please
Can I trail version for the MT4 please ? and can we use your software also at Tradovate?
Hi Antonie, yes of course, but please send me an email for that. I got nothing for Tradovate, sorry.
hi dale, if the thin profile shows what trend?
Does this work with regular stock instruments? And does it work on any timeframe?
Hello Vic B,
Yes, it works on all stock instruments, not only stocks it works on futures, forex, crypto…….etc
Yes you can apply it on any timeframe
Good Luck
I have been using Trading View and Think or Swim platforms which have Volume Profiles but not the Flexible Volume Profile you speak of. It will only show you the VP for a full day as opposed to the area you want to select within a day. Is the Flexible Volume Profile your own profile that you made? Would I be able to have access to it? If so how? Thank you.
Hello KEVIN
Yes, Flexible Volume Profile is exclusive property of mine and my developers made it upon my instructions. So you can say that it is designed by real trader not just by the mathematician/programmer 🙂
Since flexible volume profile is a paid tool and you need to purchase it in order to use it without any limits, but still you can taste it for 5 days a trial period.
If interested you can use the below link to download the volume profile and enjoy it for 5 days 🙂
https://www.trader-dale.com/td-software-downloads/
Hello there,
I’ve been watching your videos on YouTube lastly and I’ve been learning a lot just watching those videos, I am learning how to trade and I would like to start using this technique Oder Flow and Volume profile, I am only trading equities in the nasdaq & nyse just wondering if I can I use this technique also with stocks, also wanted to ask you if do you have these indicator available for TradeStation which is the platform I am currently using.
Thank you
Hi Dale. Love your work. About the P shaped, b shaped and D shaped profile that you have shared. You taught us that POC or high/low volume cluster will be the resistance/support. But in reverse, it still can be opposite right? Like you said, support become the resistance if it break and the resistance become support.
Hi,
Please can i get PDF copies of the beginner’s guide for volume profile, order flow, VWAP and stock investing.
Thanks
IT
I have to say that the way the Trader Dale show this guide is very clear and simple and very powerful trading method. Really, I like, I saw all his video and has been impressive.
I really recommend this course with him.
C. de lo Santos
Can I trail version for the MT4 please ? and can we use your software also at Tradovate?
On TradingView which indicator is most similar to the one you use (Flexible Volume Profile)?
Greetings from South Africa. I am try’ing to figure out how to to use the Volume Profile to swing trade, doesnt matter how many YouTube videos I watch, I just dont seem to get the hang of using Volume in general. I downloaded your E-book, hopefully it will explain something to me. And to be honest I have wasted a lot of money on courses, and still no luck.
Hello Dale, may i ask you a question? You completely ignore market structure (choch, bos) and work only with that what you see on chart up/down?