
Do you want ME to help YOU with your trading?
Video Transcript:
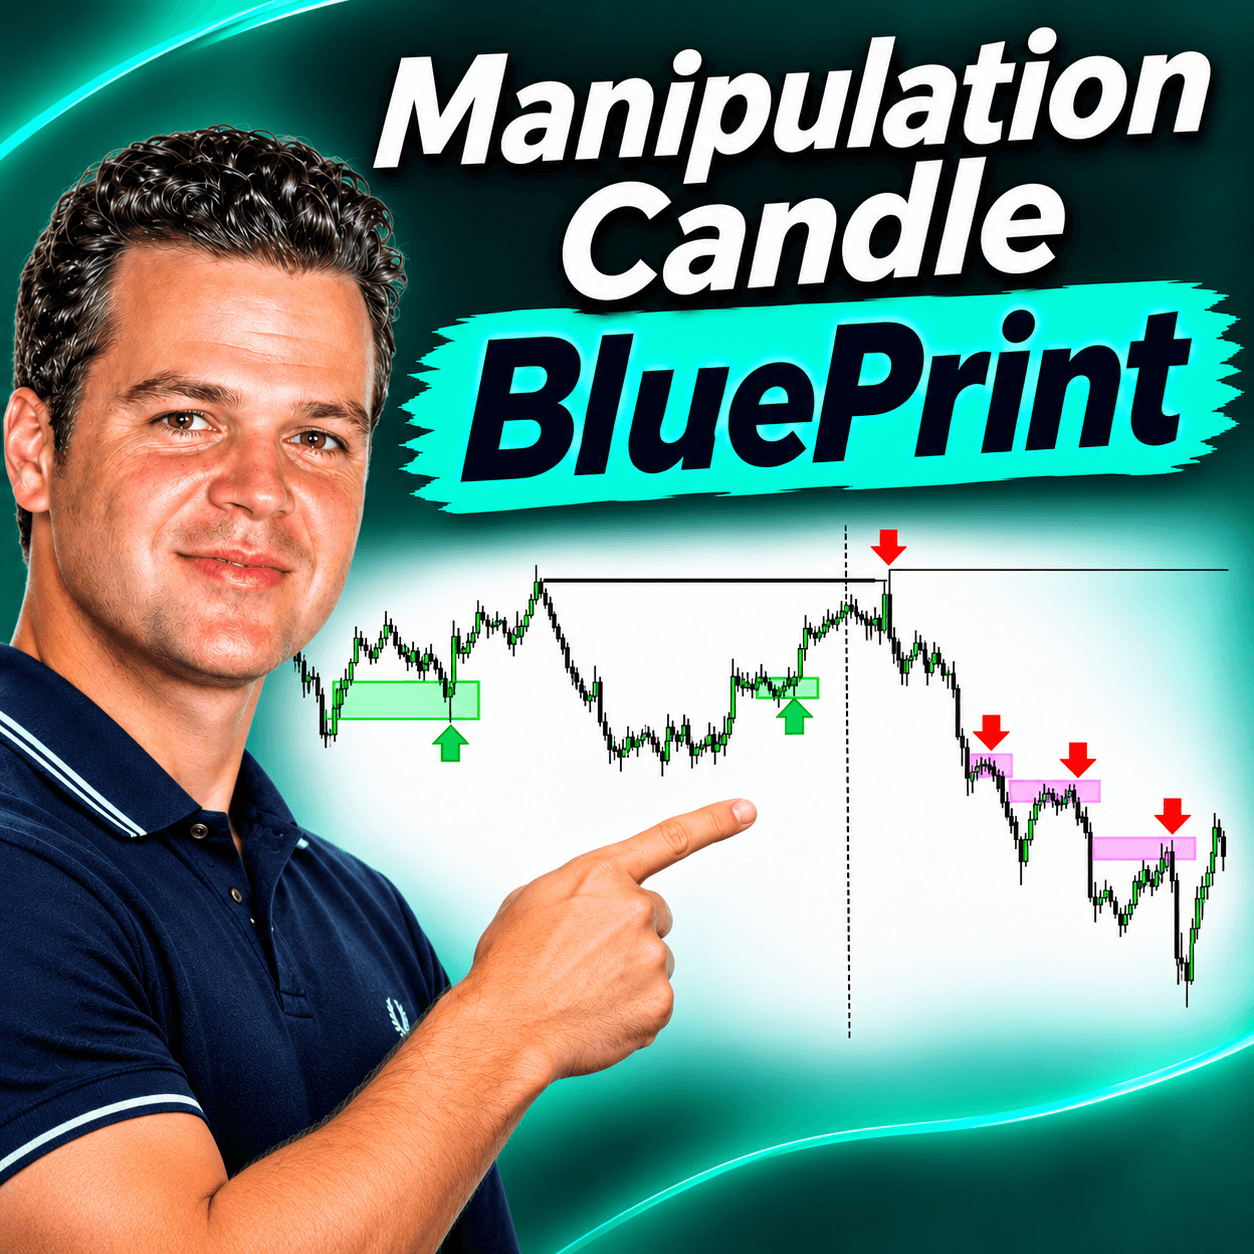
All right, good morning. This is David from Trader Dale, and today we’re going to go over a concept and a theory that I find very useful in my trading. I try to start beginner students off with these types of methods because it’s something they can notice very easily, and they can have some type of structure behind it. Now, the only thing is that it doesn’t happen every single day or every minute of the day, where people are just so in tune to trade, trade, and trade, and overtrade. But if you look at the markets, before every big move in the market, there’s usually a signature in price, and that signature in price is usually a higher-timeframe candle. All right, price discovering and rejecting. Some may say manipulating and then rejecting in the opposite direction. Now, most people understand this concept: accumulation, manipulation, distribution. Before every big move, you’re going to see that. The problem is that most traders will look for these patterns on short-term timeframes, such as 1-minute charts, 2-minute charts, and 5-minute charts, and they’re losing out on the big picture. The higher timeframes are going to show those manipulations much better because they’re going to cut out all the noise and fit it into one candle that you can wait to finish. We can call this candle science, and there are so many different variations that we can go over here. But if you look for this one type of candle in this one type of situation, this type of candle will present itself before every big move.
So, basically, what we’re looking for is at least an hourly or a 4-hour chart. Now, you could do this on any timeframe, but if you’re a day trader, you want to get these from the hourly or 4-hour charts. Now, you’re not going to execute based on an hourly or 4-hour chart. You’re just going to use it as a bias. Now, if you’re a swing trader, you can execute off these higher-timeframe charts because you have a longer-term view. Now, when I say a longer-term view, I mean over 24 hours, through the overnight rollover period, where the overnight margins will increase and where the prop firms do not allow you to trade. But for these purposes, we’re going to use these as biases.
So, how do we do that? What am I talking about? Basically, what we want is, let’s say we have two candles. That’s the high and the low of two candles. I’m not going to draw the body. In a bearish scenario, the third candle is going to take out at least two levels, and then that body is going to close. So, on an hourly or 4-hour chart, what this means is that we are taking out two liquidity levels: one and two. It has to be more than one. That’s the first rule. In a bullish scenario, it would just be the opposite. Now, this move up here has to draw into something that can either be a higher-timeframe Fair Value Gap or just a previous pivot high, a major pivot high. See, we took that out. It has to be one of them. It has to deliver from something. If it doesn’t deliver from something, it’s no good, unless it’s a continuation move. But typically, it needs to deliver from something. So, that’s basically what you’re looking for.
With that said, I gave you some bullish and bearish examples here. So, let’s just go over them. In example number one, the arrow indicates the candle we’re looking at. If you notice, we have a Fair Value Gap. So, we’re delivering from a Fair Value Gap. Check. Now, this one does not take out two levels of liquidity, but it has a major engulfing candle and a major rejection candle to the upside. If you do get an engulfing candle to the upside from this level, you don’t need the second level to be hit, meaning you don’t need two levels to be taken out. Right here, you just see one level, and I’ll show you what I mean by two levels later. But you have a nice engulfing candle here. What happens after this candle? You can now use that as a bias to trade higher, targeting that liquidity. Okay, so that’s bullish example number one.
Bullish example number two has both. We have a 1-hour Fair Value Gap here. And what does this candle do? It takes out this low right here. Let’s make this bigger. Theoretically, this takes out this low and that low. These are major swing lows on an hourly chart. You can’t really see these on a 1-minute chart, but on an hourly chart, it’s very clear. So, what does this tell me? It swept the lows. It defended a bullish Fair Value Gap. And not only did we respect it, move away from it, and close above it, but we also engulfed it, which makes it even better. What happens in the next couple of candles? We use that as a bullish bias to trade higher.
Now, let’s look at a few bearish examples. Here we have a candle that takes out a previous high. This is not something where we’re moving into a Fair Value Gap. It’s a previous high. As you can see, there’s a strong rejection to the downside. We don’t need to trade this candle, but we can use the candles after it as a bias to trade lower and continue to do so until we reach the target liquidity, which is right here.
Now, let’s look for continuation moves. We have a move lower. We have a 1-hour Fair Value Gap that’s been tagged. We now have a two-candle formation here with highs. We take out this high with a strong rejection and engulf it by a little bit. Not by much, but we engulf the low. What happens after that? It sets up for a strong move lower. As you can see with this candle right here, what do we do? We take out this high. We manipulate this high before going lower. This is another confirmation. So, sometimes you get a trade, and then you get following candles that start doing the same thing. When you start to see manipulations like this, manipulations and lower, manipulations and lower, then you know the order flow is bearish.
Let’s look at another situation. This is a consolidation. We have a high right here, equal highs right here, and a 1-hour Fair Value Gap just above. What does this candle do? It taps into this Fair Value Gap and rejects. Now, during this time, a lot of people are losing money. The price is moving up. It’s taking out the longs, taking out the shorts, and getting new longs in. Then it rejects here, starts taking out the longs, and gets new people short. And now the direction happens. As you can see, after every single one of these candles that takes out multiple levels with a strong rejection, the candles that follow have big moves down. You don’t need to trade this candle. You just need to start using it as a bias and trade the next candles after it.
Okay, the last example. This happened yesterday. We have a 1-hour Fair Value Gap right here, clean and untapped. We have a high. What is this? What does this candle do? It takes out all these highs, taps into the gap, and rejects with momentum. What happens on the next candle? We can now use this candle to go short and trade. We do not need to trade this candle. This candle is where very advanced professional traders are trading. This is where retail traders are getting stopped out. They’re getting stopped out on their shorts on this move, and then they’re getting stopped out on their longs on the way back down. This is because this is accumulation, this is manipulation, and this is distribution. You can see these things much better on a higher-timeframe chart.
If you just wait for candles like this to deliver into these areas, and you backtest this, then start trading the candles after them as a bias, you will see that you won’t even trade until you see one of these candles. You’ll only trade after those candles because you’ll know they’ll be such high-probability setups. You can look at these on any timeframe. Now, I would not look at these on anything less than a 1-hour chart. A 1-hour, 4-hour, daily, weekly, or monthly chart will all give you a bias and execution levels. If you’re swing trading, you can execute from these levels. If you’re day trading, you need to stick to the 1-hour and 4-hour charts because then you need to go down to the lower timeframes. You need to be able to get in and out within the trading day. Executing and trading off a 1-hour or 4-hour chart does not work during the day. But it does work for swing trading.
So, what do I mean? If I’m swing trading, I wait for this candle to close. On this candle close, or after a little pullback, I go short right here. Let’s say my stop is right above. I target those lows. That’s a 1.5-to-1 risk-to-reward ratio, with a little bit of a runner, maybe a little more. That’s a swing trade.
Same thing here. This candle closes. I go short right on the close. I target those lows. The stop is going to be just above, giving me a 2.36 risk-to-reward trade. That’s a swing trade.
This happened a little sooner, but again, you need to approach it as a swing trade. We can’t do that as day traders here. This move happens here. I go short right at the close. My stop is going to be there, and again, this is only for swing trading. My first target is going to be there, giving me a 2.57 risk-to-reward ratio or lower.
You can either execute this as a swing trade or use it as a bias for day trading. So, for execution on a swing trade, my stop is going to be there, my short entry is going to be there, and my target is going to be those lows right there. Now, my stop doesn’t need to be this high. On this one, my stop can be a little bit here. So, you’re getting at least a 2.5 risk-to-reward trade, but this has to be a swing trade. You can’t do this properly as a day trade.
But if I’m swing trading, I’m entering here, putting my stop in, and forgetting about it. I’m targeting here. If I’m day trading, I’m now using the next candles to go down to my 1-minute charts and look for short-term executions to follow as a bias. Simple as that.
Backtest this yourself. Look at these candles. I’m telling you right now, if you only trade these candles, it will change your trading forever. This one little trick. Let me know how it works out. If you want any more help with it, contact us. We have many different options for you if you’re interested in and resonate with the way we trade.
Have a great day. Be safe during this election season. There’s a lot of volatility right now, so just be safe out there. Have a good day.