
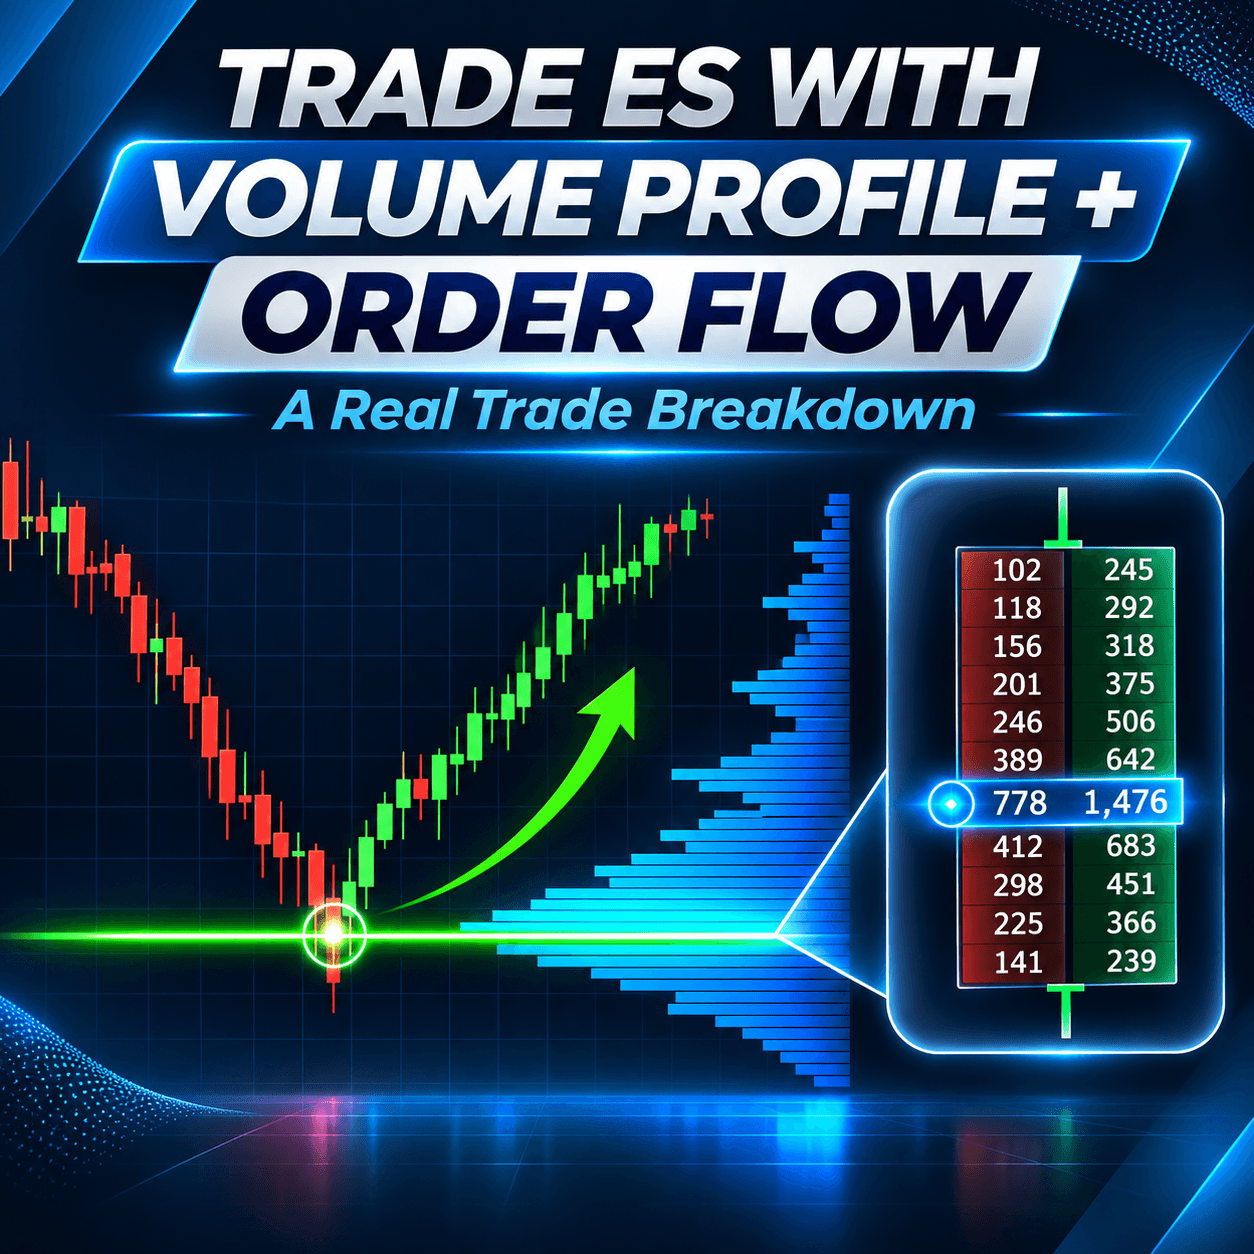
Have you ever drawn a support line, watched price hit it, and then seen it slice straight through? It happens to every trader. The fix is not a magic indicator. The fix is a clear process. In this article, I’ll show you how to trade ES using Volume Profile and Order Flow together, step by step.
I’ll use a real trade I took on the ES, the S&P 500 futures contract. You’ll see the whole trade from A to Z. You’ll see what I looked at, what I waited for, and why I finally pulled the trigger. I have spent years trading futures with these two tools, and this is the same routine I still follow every day.
Here is the simple idea behind it. Volume Profile shows you where to trade. It finds strong support and resistance zones. Order Flow shows you when to trade. It confirms that big players are actually stepping in at your level. One tool gives you the map. The other gives you the green light.
By the end of this guide, you will know how to find strong support on a 30 minute chart. You’ll see how a Fair Value Gap can make that level stronger. You’ll learn to read absorption and delta divergence in the footprint. Finally, you’ll learn where to place your stop loss and take profit using heavy volume zones.
Open your charts, and let’s walk through this trade together.
Table of Contents
Article in 5 Points
- Volume Profile on the 30 minute chart finds your support and resistance zones.
- A sharp reversal plus a heavy volume zone creates a strong level, and a Fair Value Gap adds extra confluence.
- Order Flow on the 5 minute chart confirms whether big players defend that level.
- Absorption, delta divergence and aggressive buying were the three signals behind this ES long.
- Place your stop loss behind a barrier and your take profit before the next barrier.
How Does a Volume Profile and Order Flow Strategy Work on ES?
Start With the Big Picture
Every trade I take starts on a higher timeframe. For ES, that is usually the 30 minute chart. Why? Because small charts are noisy. A 1 minute chart can make every tiny wiggle look important. The 30 minute chart cuts out that noise and shows what really matters.
On this chart, I use Volume Profile. It is a tool that shows how much volume traded at each price level. Most charts show volume at the bottom, spread across time. Volume Profile turns that sideways. It shows volume on the price axis instead. That tells you which prices the market cared about most.
Where lots of volume traded, many traders opened positions. Those traders often defend their positions later. That is why heavy volume zones so often act as support or resistance.
Then Zoom In for Confirmation
Once I have my level, I don’t just place a limit order and walk away. I wait. When price gets close to my level, I switch to a smaller chart. In this trade, I used a 5 minute chart with Order Flow on it.
Order Flow shows you what happens inside each candle. You see how many contracts were bought and sold at each price. You also see who is aggressive: buyers or sellers. This helps you answer one key question. Are big players actually stepping in at my level?
Tool | Timeframe | Job | Question It Answers |
Volume Profile | 30 minute | Find support and resistance | Where should I trade? |
Order Flow | 5 minute | Confirm the entry | Should I trade right now? |
Volume Profile | 30 minute | Set stop loss and take profit | Where do I get out? |
Think of it like crossing a busy road. Volume Profile tells you where the crossing is. Order Flow is the traffic light. You need both to cross safely.
How Do You Find Strong Support With Volume Profile?
Spot the Reversal First
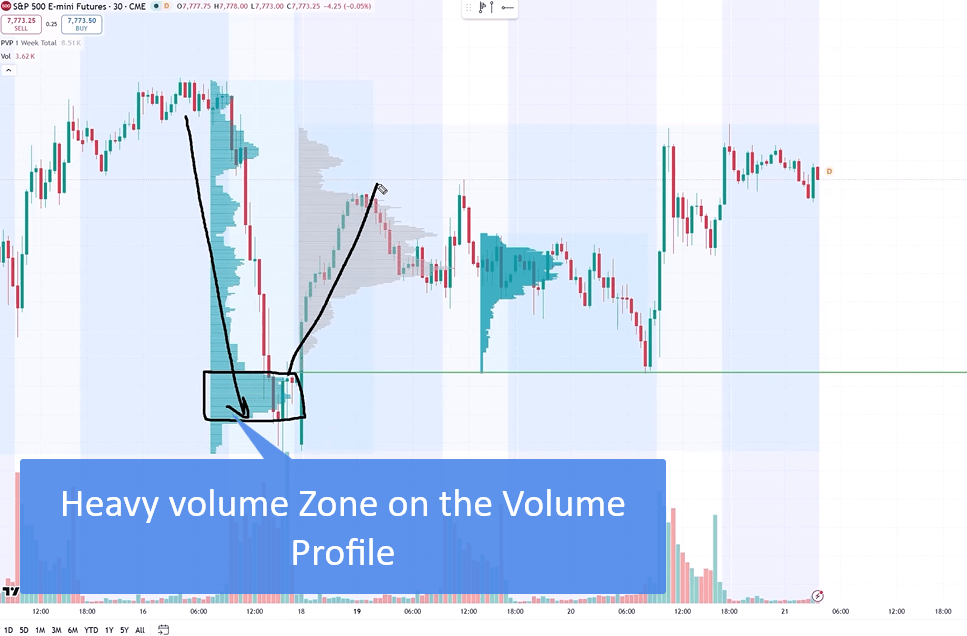
For this trade, I was watching a strong sell off that happened on Friday. Price dropped hard into the close of the day. Right at the close, a heavy volume zone formed.
Then Monday came, and the picture changed completely. Price reversed and went up aggressively. Sellers had pushed price down, but buyers took over and drove it back up.
When I see a move like this, I pay attention. A sharp reversal is a strong rejection of lower prices. It tells me the market did not want to stay down there. That makes the area important all by itself, even before I check the volume.
Check for a Heavy Volume Zone
Next, I look at Volume Profile around the turning point. I want to see a significant volume zone right where price turned. That is exactly what was there.
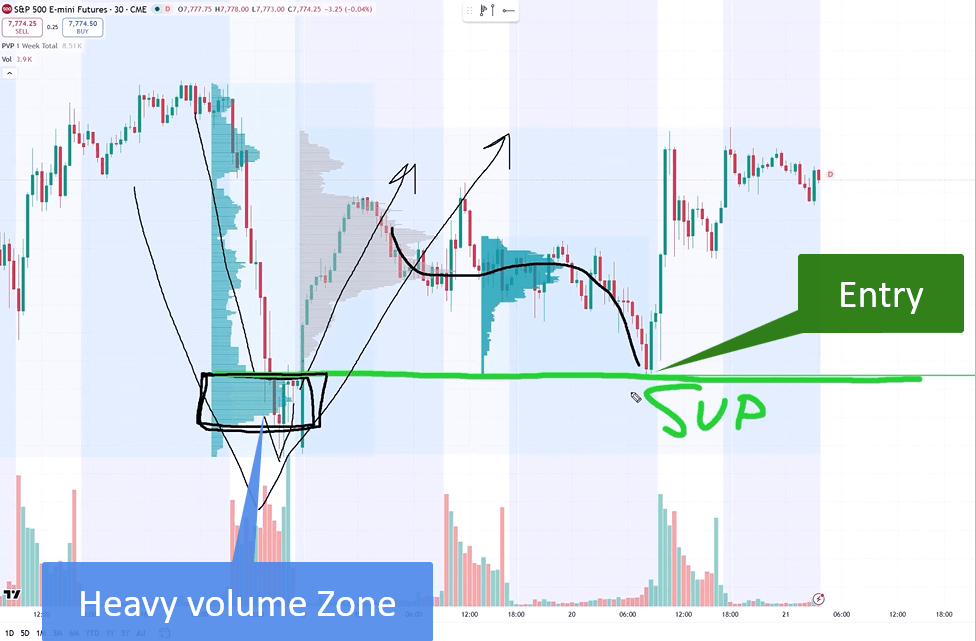
In a bullish scenario like this, I draw my line at the beginning of that heavy volume zone. That line becomes my support.
Why does this work? Think about the buyers who turned that sell off around. They opened long positions in that zone. When price comes back, those buyers want to protect their trades. So they often step in again and push price up. That is why price should react there.
The Rejection Setup in Simple Terms
I call this the rejection setup. Here is a quick checklist you can use on your own charts:
- Price makes a strong move in one direction.
- Price then sharply reverses.
- A heavy volume zone sits right at the turning point.
- You draw your level at the start of that zone.
If all four boxes are ticked, you have a level worth watching. If one is missing, the level is weaker. Don’t force it. There will always be another setup tomorrow.
Why Did a Fair Value Gap Make This ES Level Stronger?
What Is a Fair Value Gap?
A Fair Value Gap (FVG) comes from Smart Money Concepts. It is a price area where the market moved so fast that it left a gap. On a chart, you see it as a space between candle wicks that do not overlap. Price often comes back later to test these gaps.
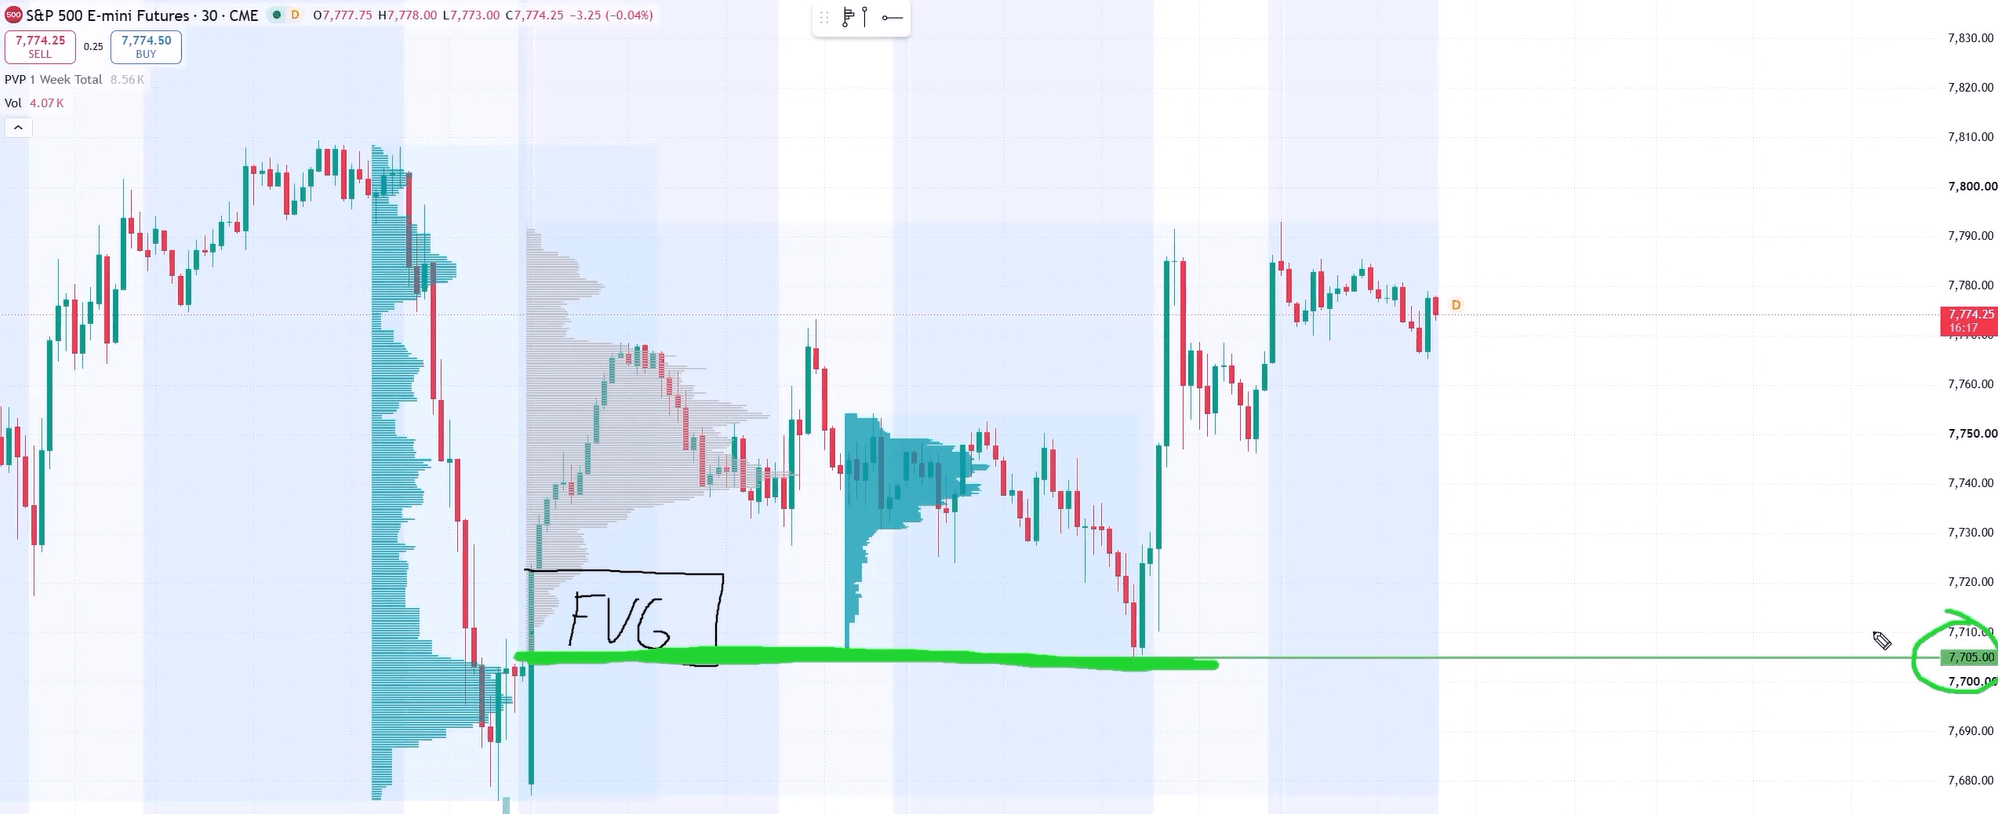
In this trade, there was a bullish Fair Value Gap. A bullish FVG begins at its lower edge. And here is the good part. That lower edge sat exactly at the start of my heavy volume zone.
That’s why I placed my support at 7705. It lined up with the start of the Fair Value Gap and the start of the heavy volume zone. When two separate tools point to the same price, the level becomes more interesting. Traders call this confluence.
Clue | What I Saw | What It Tells You |
Sharp reversal | Friday sell off, Monday rally | Buyers rejected lower prices |
Heavy volume zone | Big volume at the turning point | Many long positions to defend |
Bullish FVG | Gap starting at 7705 | Price imbalance at the same level |
Monday open | Opened below Friday’s close | A reason for caution |
Why I Still Wanted Confirmation
Even with all this, I was not fully sure about the level. Something felt off. On Friday, the market closed at one price. On Monday, it opened lower, below that close. That gap at the open was a bit weird.
So I did not want to blindly buy at 7705. I wanted proof. My goal was to see buyers jumping in when price reached my level. Big players needed to notice this level too.
This is a habit worth building. A level is just an idea until the market confirms it. Some levels hold. Some break. You can’t know in advance. But you can watch how traders behave when price arrives. That’s where Order Flow comes in.
What Does Absorption Look Like in the Order Flow Footprint?
Setting Up the 5 Minute Chart
With my level ready, I opened a 5 minute chart of ES. The green line on it was my Volume Profile support at 7705.
For Order Flow, I used TradingView’s Order Flow tool. My version looks a little different from the default. I adjusted the settings so everything is clearer to read. On top of that, I added my new indicator called Big Players Radar. More on that in a moment.
If you want to copy my layout, I’ve put a setup guide below the video. It makes the footprint much easier to read.
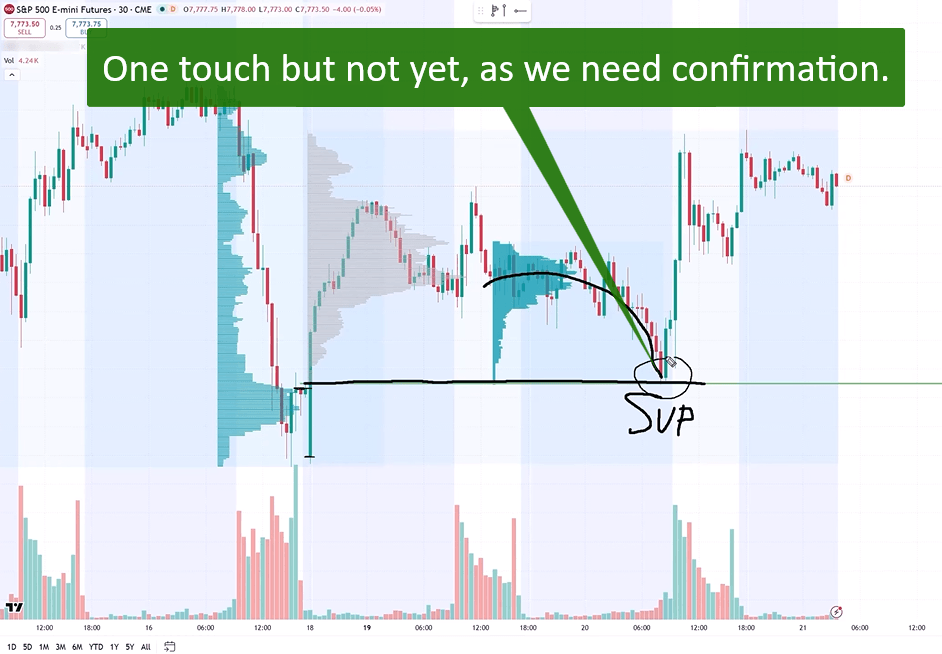
The First Touch: No Signal, No Trade
Price dropped toward my support and touched it for the first time. I watched the footprint closely. Honestly, I saw nothing. There was no sign of buyers stepping in.
So I stayed out. No confirmation means no trade. This sounds simple, but it saves a lot of money over time. Many traders jump in at the first touch because they are afraid of missing the move. Waiting one more candle often gives you much better information.
The Second Footprint: Absorption
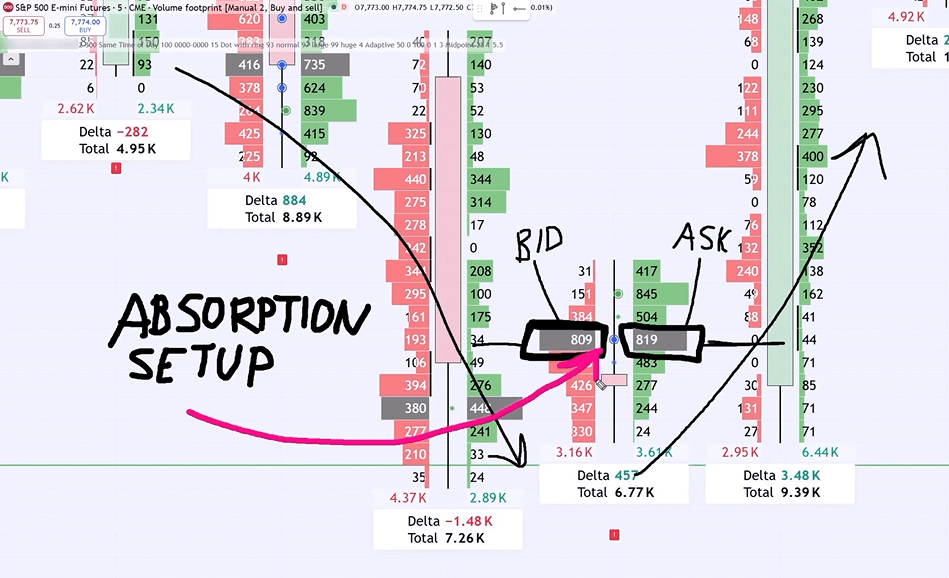
The next footprint was different. This is where I spotted strong buyers jumping in.
At the same price, there was unusually heavy volume at the bid and unusually heavy volume at the ask. Let me break that down:
- Heavy volume at the bid means aggressive sellers were hitting the market and pushing price down.
- Heavy volume at the ask at the same price means buyers were buying just as hard.
The sellers were selling. But the buyers were taking everything the sellers had to sell. That is called absorption. Buyers absorbed the selling pressure like a sponge soaks up water.
I call this the absorption setup. It was my first reason to join the buyers and go long.
Which Order Flow Signals Confirmed the Long Entry?
How Big Players Radar Spots Unusual Volume
Absorption needs unusually heavy volume. But what counts as unusual? Unusual for today’s session? Or unusual compared with past days? That question was always hard to answer.
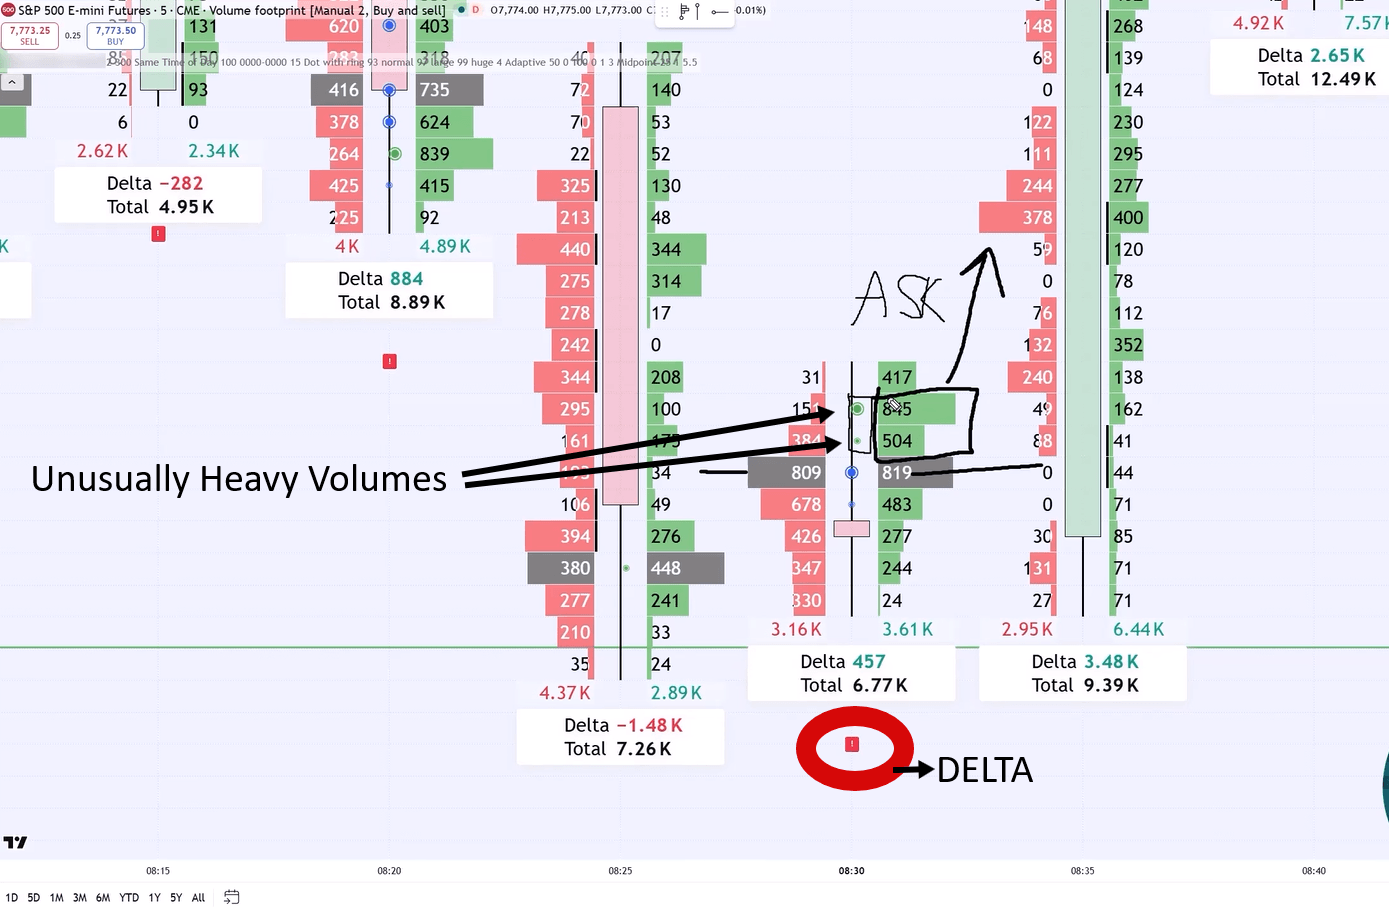
So I built an indicator to answer it. Big Players Radar looks back in time. It compares current volume with the volume at the same time of day in past sessions. If the volume is unusually heavy for that instrument at that time, it prints a small target on the chart.
- A blue target means absorption, with heavy volume on both sides.
- A green target means heavy volume at the ask, which shows aggressive buyers.
This makes it easy to see when big players, not just small retail traders, are getting involved.
Signal Two: Delta Divergence
Delta is the difference between aggressive buyers and aggressive sellers. Positive delta means aggressive buyers were stronger. Negative delta means aggressive sellers were stronger.
In this footprint, delta was positive. Yet the candle was bearish. Price was still dropping. That mismatch is a divergence between price and delta, and Big Players Radar marks it with an exclamation mark. Even while price was falling, buyers were already in control inside that candle.
Signal Three: Aggressive Buyers at the Ask
Right after that, two green targets appeared. That meant unusually heavy volume at the ask. Aggressive buyers were now pushing price up.
Signal | What I Saw | What It Means |
Absorption | Heavy bid and ask volume, blue target | Buyers soak up the selling |
Delta divergence | Positive delta on a bearish candle | Buyers dominate under the surface |
Aggressive buying | Heavy ask volume, green targets | Big buyers start pushing price up |
I went long at the absorption. Every signal after that pointed the same way. And the important part is who was buying. It was big players, not just small retail traders. That is why I pulled the trigger.
Where Should You Place Stop Loss and Take Profit With Volume Profile?
Go Back to the Big Picture
The entry is only half the job. Your exit plan matters just as much. For this, I go back to the 30 minute chart and use Volume Profile again. It shows the zones that can stop price or push it back. Those zones decide where my orders go.
Stop Loss Goes Behind a Barrier
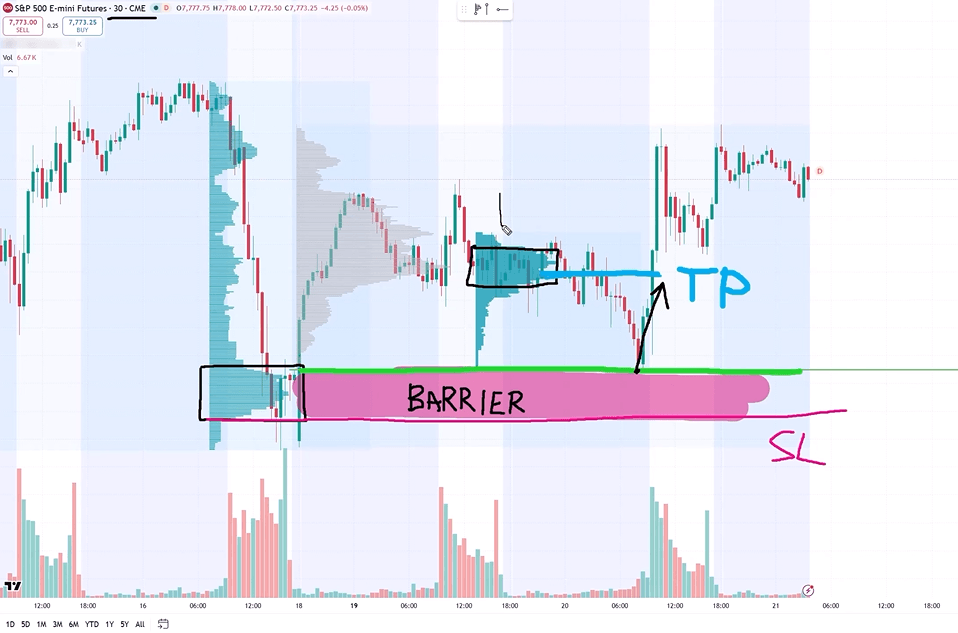
My support level was based on a heavy volume zone. That whole zone acts as a barrier. I place my stop loss behind that barrier, just below the zone.
Why behind it? If price breaks through a barrier, there is no way to tell where it will stop next. The buyers who should have defended it have clearly given up. At that point, the trade idea is wrong, and you want to be out.
Take Profit Goes Before a Barrier
The take profit works the other way. It should go before the first barrier in the way of your trade.
In this ES trade, another heavy volume zone sat above my entry. That zone could act as resistance. Price likes to react to heavy volume zones. So there was a real risk that price would stall there and turn down. I didn’t want to take that risk. I exited my long just before that zone.
What Happened Next?
Price actually kept going straight through that resistance, as if it was not there. Did I know it would? No. Nobody did. Taking profit before the barrier was still the right call based on what I knew at the time. Good trading is about following your rules, not guessing the future.
Order | Rule | Why |
Stop loss | Behind a barrier | Price can run far once a barrier breaks |
Take profit | Before the first barrier | Price may react and reverse at the barrier |
FAQ
Can I use Volume Profile and Order Flow on markets other than ES?
Yes. The same logic works on any liquid futures market with reliable volume data. Heavy volume zones and absorption appear on every busy market.
What timeframes work best for this ES strategy?
I use a 30 minute chart to find levels and set exits. I use a 5 minute chart with Order Flow to confirm the entry.
What should I do if Order Flow shows no confirmation at my level?
Stay out. In this trade, the first touch showed nothing, so I waited. No confirmation means no trade.
Conclusion
Let’s recap what you learned in this ES trade breakdown. Trading with Volume Profile and Order Flow is about splitting the job into clear steps. Each tool does one thing well.
First, I used Volume Profile on the 30 minute chart to find support. A strong sell off on Friday turned into a sharp reversal on Monday. A heavy volume zone formed right at the turning point. That gave me the rejection setup. A bullish Fair Value Gap started at the same price, 7705, which added confluence.
Next, I waited for Order Flow on the 5 minute chart. The first touch showed no buyers, so I stayed out. The second footprint showed absorption, with heavy volume at both the bid and the ask. Big Players Radar then flagged a delta divergence, and aggressive buyers appeared at the ask. That was enough proof that big players were defending the level.
Finally, I went back to Volume Profile for my exits. My stop loss went behind the heavy volume barrier. My take profit went before the next barrier in the way.
The key lesson is simple. Find your level first. Then wait for the market to confirm it. Then plan your exits around volume. Follow those three steps, and every trade you take will have a clear reason behind it.
Ready to Learn the Full Strategy?
Want to learn how I trade with Volume Profile and Order Flow from A to Z? Visit Trader-Dale.com and click “Trading Course and Tools.”
Apply my coupon code KEVIN10 to get a 10% discount on your pack purchase.