
*Disclaimer: Presented opinions, trades and trading ideas on the markets and charts is not advice nor a trading recommendation. It is general information and it is for educational purposes only.
**You can learn more about my trading setups in my new book: VOLUME PROFILE: The insider’s guide to trading
SWING TRADES
All presented swing trade charts are Daily charts (Daily candles) if not stated otherwise.
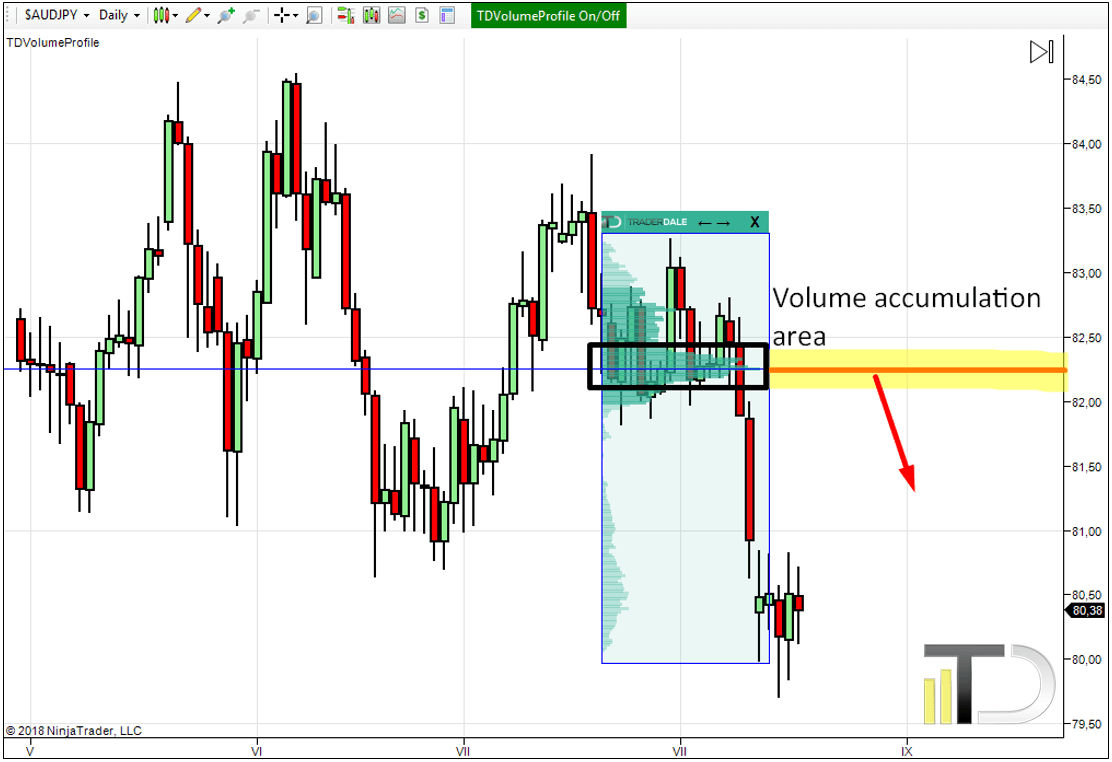
AUD/JPY short from 82.25
The main reason behind this short level is Volume accumulation setup. Heavy volumes were accumulated in a rotation area (marked in black rectangle). After that, the price shot aggressively downwards which indicates that the heavy volumes were mostly volumes of strong sellers. When the price makes a pullback into this significant area again, I think that the sellers will try and defend their short positions and that they will push the price lower.
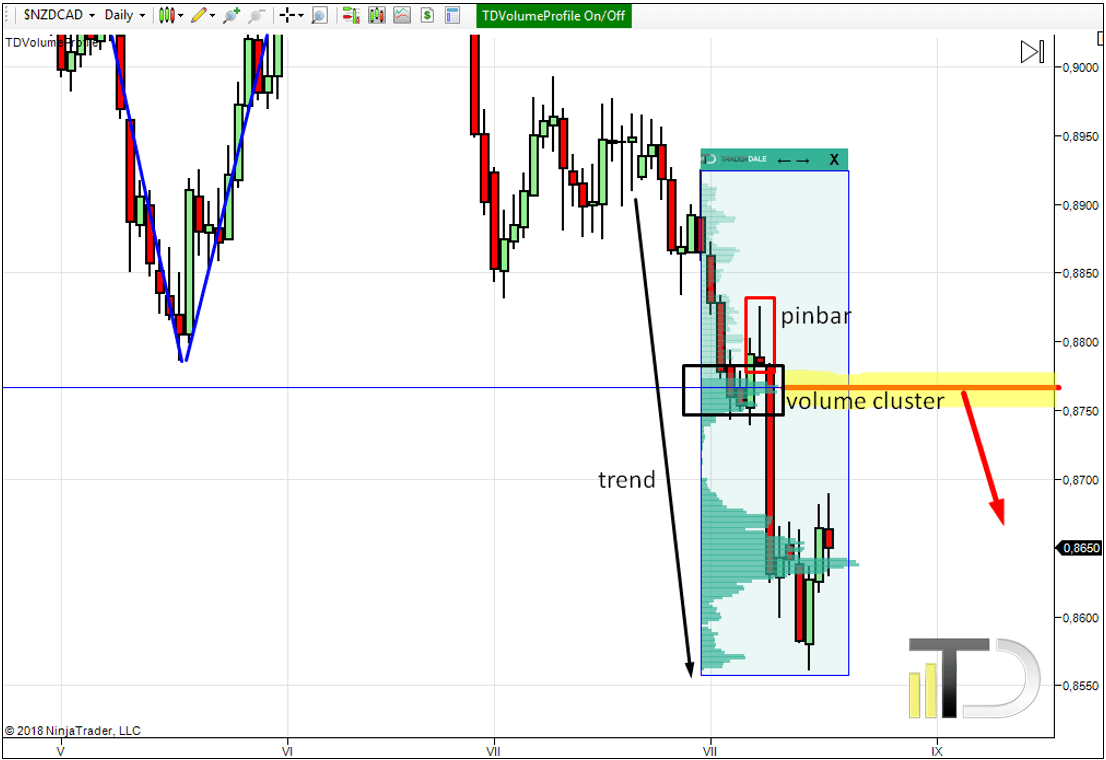
NZD/CAD short from 0. 8767
This trade idea is based mostly on a Trend setup. There is a strong downtrend on the NZD/CAD right now. In such case, I look for volume clusters that were created within the downtrend. Such a volume cluster as around 0.8767 shows us that sellers were adding to their selling positions there and that they continued pushing the price lower from this area. When the price makes it back to this area again (pullback), then those sellers are likely to defend their positions and push the price lower.
Another confirmation of this level is as Support becoming resistance Price Action setup. Quite near our short level, there was a pretty strong rejection of this level in the past – marked in blue. This indicates that it was a strong support in the past. When the price went through this support then it became a resistance.
There is one more thing about this level which I like – it is the pinbar candlestick (I marked it in the red rectangle). This pinbar shows us aggressivity of sellers, which again confirms the idea of a short trade from 0.8767.
INTRADAY TRADES
All presented intraday charts use 30-minute timeframe (30-minute candles).
You need to be really careful with trading intraday trades around macroeconomic news. Click here to learn how to handle the macroeconomic news.
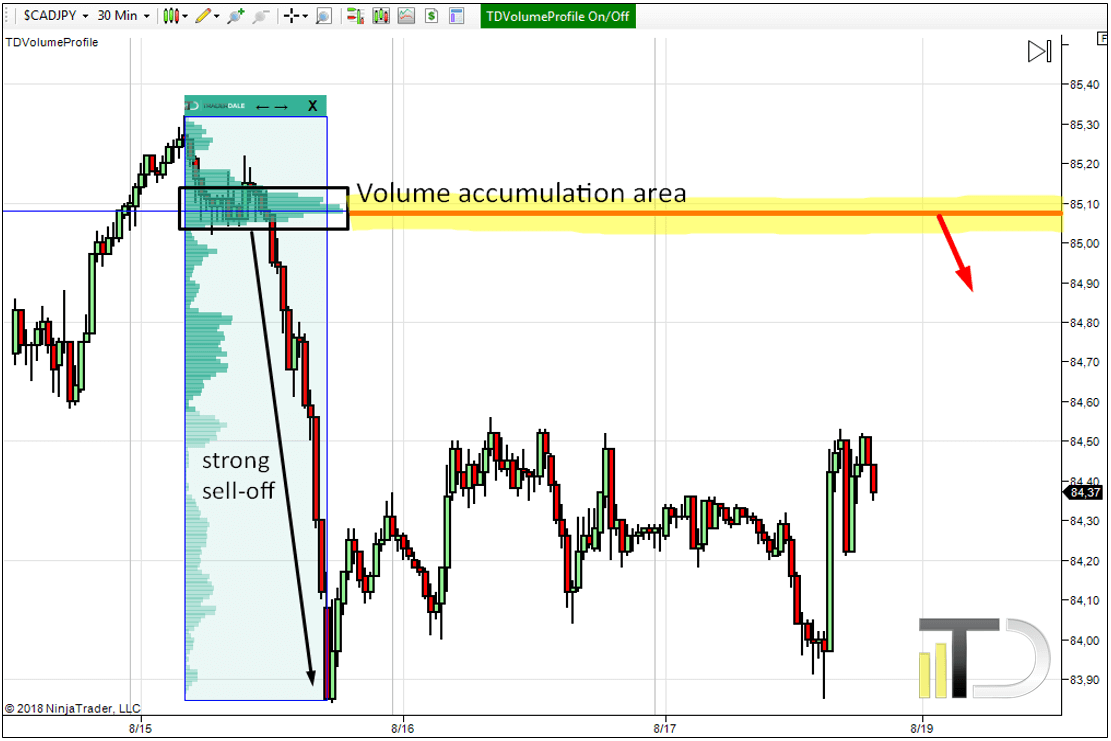
CAD/JPY short from 85.08
Pretty heavy volumes got accumulated around the 85.08 area. Then a really strong sell-off started. This is a sign of strong sellers accumulating their selling positions first and then pushing the price lower. When the price makes it back to this level I expect a reaction, because those strong sellers are most likely to defend their selling positions and to push the price lower again.
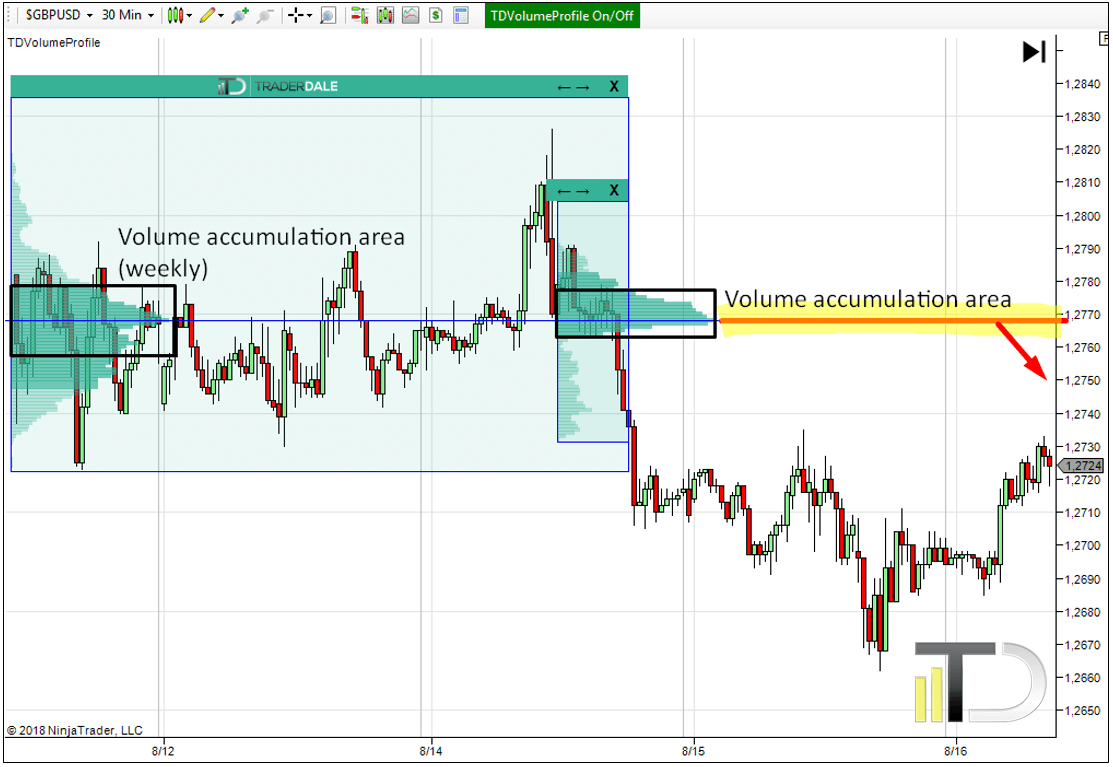
GBP/USD short from 1.2768
First I need to say that I don’t usually trade the GBP/USD because it is a pretty wild pair to trade. However, when I spot a good trading opportunity there (like now) I take it.
The pound was in a pretty long rotation the major part of the week. If you look at the cumulative profile then you can see it formed a D-shaped profile which indicates a temporary balance between buyers and sellers – and also a volume accumulation. Afterward, there was a false breakout to the upside of the channel and then a strong sell-off. It is the false breakout and sell-off that shows us that there were strong sellers accumulating their selling positions in the volume accumulation area.
You can also notice pretty heavy volumes accumulated in the rotation right before the start of the strong selling activity. Nice confirmation of our short level is that POC of both of the rotations is exactly at the same price level (1.2768)
When the price makes a pullback to the 1.2768 level again I think that the strong sellers who were accumulating their selling positions there will defend their positions and they will push the price lower again.
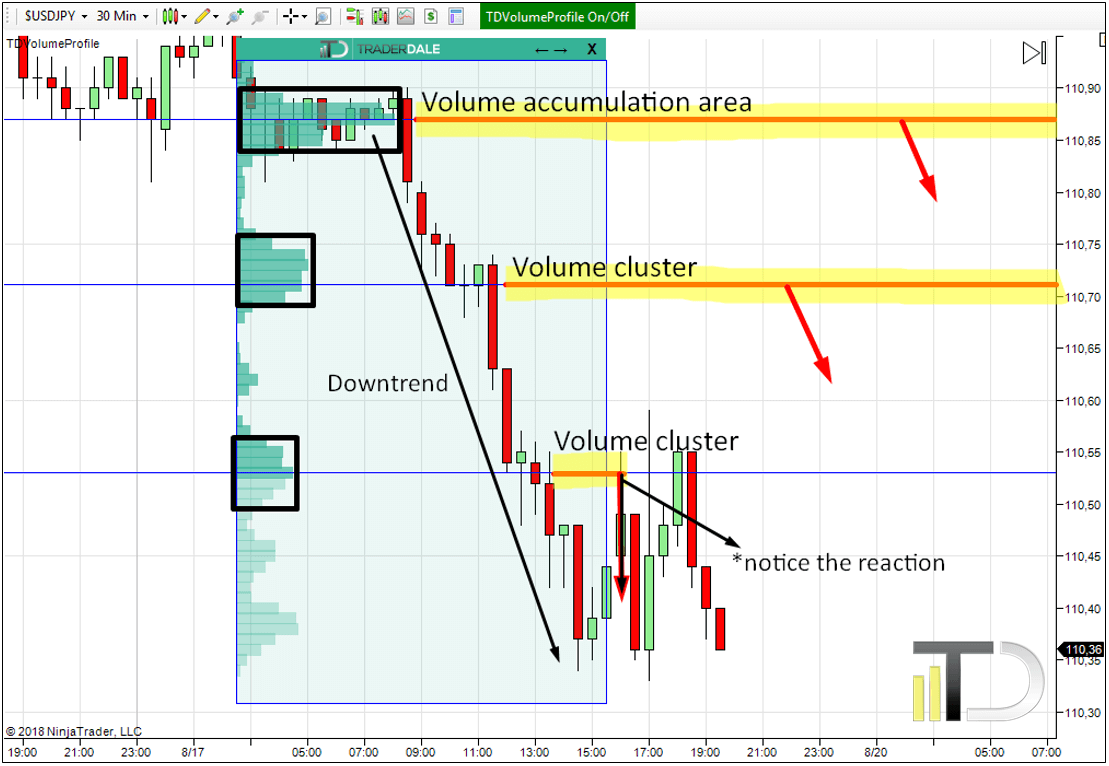
USD/JPY short from 110.71
This level is based on the “Trend setup” which I use when there is a strong trend – like now on the USD/JPY. I expect that strong sellers who were adding to their selling positions there will defend their positions and push the price lower again (when there is a pullback).
*Notice the nice price reaction to the volume cluster around 110.53 – this was also a “Trend setup” but now it is not valid anymore because there already was a reaction to it.
USD/JPY short from 110.87
There was a significant volume accumulation right before the strong selling activity started. This tells us that strong sellers were building up their positions there and that they pushed the price lower afterward. When the price makes it back to this area again, I expect that those sellers will be defending their positions and that they will push the price lower again.
I hope you guys found my ideas inspiring and useful.
Happy trading
-Dale
PS. I have just released a new book: VOLUME PROFILE: The insider’s guide to trading. I put a ton of work into it and I am sure it will prove extremely helpful to you. Go and get your copy HERE. I guarantee you that this will be the best $4.99 you ever spent.
PPS. I am using my custom made Flexible Volume Profile for all my analysis. You can get it here: TD’s Flexible Volume Profile
PPPS. Want my intraday trading analysis every day as well as swing trade analysis for 15 forex pairs every month? Then check out my Advanced Volume Profile Training Course and Members Forum for more information – Click Here to Start Learning Now
I agree, i am watching on gbpusd, that is monthly POC and price reaching to level with balanced daily profiles. Stop 91 low volume or smaller?
as intraday trade 10/12 this was already a profit.
If you want a wider SL then 91 is a good place.