
Video Transcript
Hey guys, this is a video on how to use the Big Players Radar TradingView indicator that I just made. So, let me demonstrate how to use it on a recent trade on the NQ. First, before we jump into the order flow and the radar, I need to show you how I actually identified the support that I was trading using the Big Players Radar because it’s always about finding a strong support or resistance zone and then using order flow with the radar.
Okay, so first, let’s find the level to trade from. Here, you can see the 30-minute chart of the NQ, and the level I was trading was based on this heavy volume zone, which formed within this strong rejection of lower prices. That heavy volume zone represented places where buyers stepped in, and from there, the uptrend started. My support was at the beginning, or roughly at the beginning, of this heavy volume zone. It was not just the beginning of the heavy volume zone; it was also the beginning of a Fair Value Gap right here. This was the Fair Value Gap, and this was the beginning of the Fair Value Gap. Since we were looking at a bullish Fair Value Gap, this was the beginning, right? So, that was the level right here, 29,400.
Then I was waiting for a pullback, and when the price reached this support, I wanted to see confirmation on the order flow and the Big Players Radar. So, let me now show you what happened at this point.
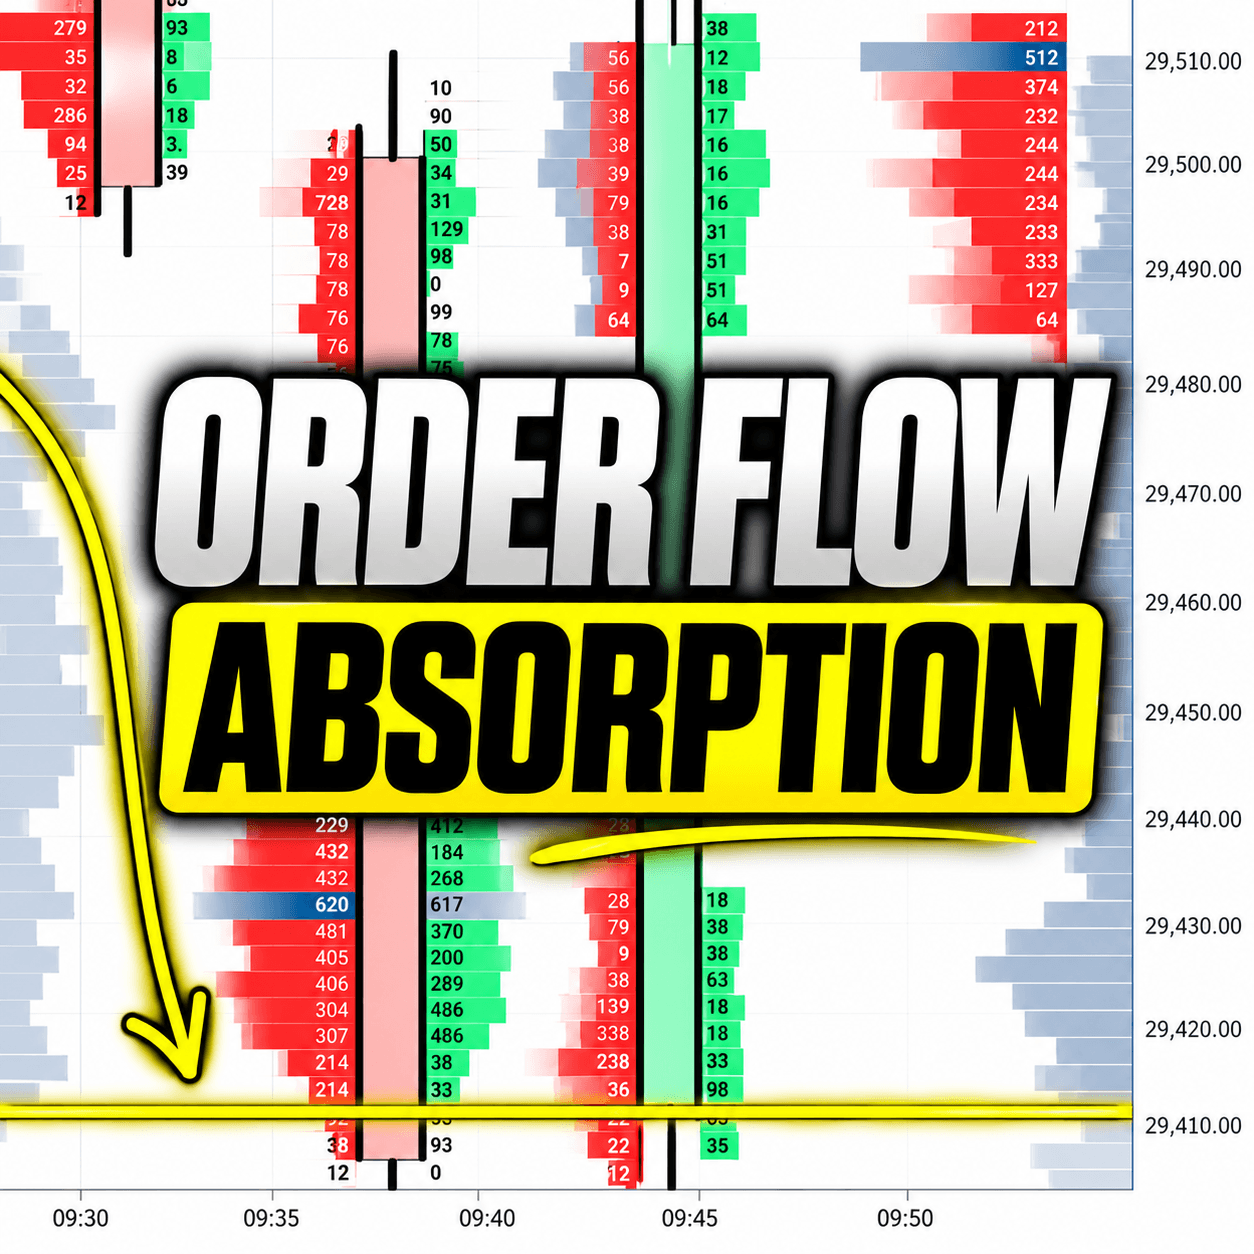
What you see here is a 5-minute chart of the NQ, and this is the order flow layout. Right here, you can see how the price was dropping towards the support. The support was this green line. Now, when the price was dropping towards it, there was one very interesting thing that happened here. You can see this on the Big Players Radar: those dots. The most important ones, I would say, are those two blue dots. What they mean is that unusually heavy volumes were traded both at the bid and at the ask. That means in those two cells and in those two cells.
By unusually heavy volumes, I mean volumes that are way above the average trading volume at this time of day. The software looks way back in history and compares the same time of day as when this volume was formed. If the volumes are way above normal, then it’ll mark them. This is very, very important because what you really want is to compare the volumes and how extraordinary they are. You want to compare them with the same periods in history to be able to tell what actually constitutes unusually heavy volume, right?
So, this is what’s very, very important about the Big Players Radar: it’s able to do this and show you those places where unusually heavy volumes were traded. Here, it marks heavy volumes both at the bid and at the ask. That means one thing: absorption. Absorption is taking place in those two cells. And that’s actually enough for you to jump into a trade because you can see that big players are stepping in with unusually heavy volumes. That means they see the support. They are jumping in, they want to enter trades, and then they want to profit from this move.
This occurred a little bit before our support, but I would still say it was within the range where it’s okay to take the trade. There were also two green bubbles, targets, or circles showing aggressive buyers. And not just any aggressive buyers, but aggressive buyers with unusually heavy volumes, right? Again, the software works the same way as with the absorption setup. Here, using those green bubbles, it shows aggressive buyers with unusually heavy volumes, and that’s another confirmation for you to jump into the trade, okay?
And this is actually everything you need to confirm that buyers are stepping in and that you should enter the trade. That’s all you need.
There’s one more thing that I want to mention, though, and that is a bear trap. Our Big Players Radar software also prints this below each footprint where there are trapped buyers or trapped sellers. In this case, it was trapped sellers, those guys. Trapped sellers, see? Those imbalances, those are imbalances. But those guys got stuck at the bottom, and then buyers started to push the price upwards. This is another signal for you to jump into the trade.
The question is, when do you actually discover that this is a bear trap? In this case, it would be quite late because this whole candle needs to close before you can actually tell that those guys are trapped traders. So, in this case, I would say this was a bit late because the reaction was just, you know, too swift. But the confirmation through absorption and the confirmation through huge aggressive buyers are there, confirming the trade entry, okay?
So, this is how you work with the software. It’s very, very easy and very, very intuitive. One thing that’s extremely important is that you look for those signals, those bubbles, and those big players around strong support and resistance zones, not just anywhere on the chart, right? If they appear just anywhere on the chart without any context, they don’t really mean too much, right?
But when you identify strong support or resistance, like we did here with the Volume Profile, and then you see big player activity around that support or resistance using this software, bingo! That’s where you join the party and enter the trade.
All right? So, I hope you guys found the video useful, and I’ll see you around.