Have you ever entered a trade because the price action looked like a textbook “V” shape, only to watch it crumble and hit your stop-loss? In this guide, I will show you how to identify a trading reversal failure using my proprietary 4-step checklist. By understanding the mechanics of a market “trap,” you can stop losing money on setups that look perfect on the surface but lack the institutional engine required to follow through. In this article, I draw on my years of experience as a professional trader to help you navigate these volatile zones with precision and avoid the common pitfalls associated with a trading reversal failure.
Table of Contents
Why Most Traders Fall for the Reversal Trap
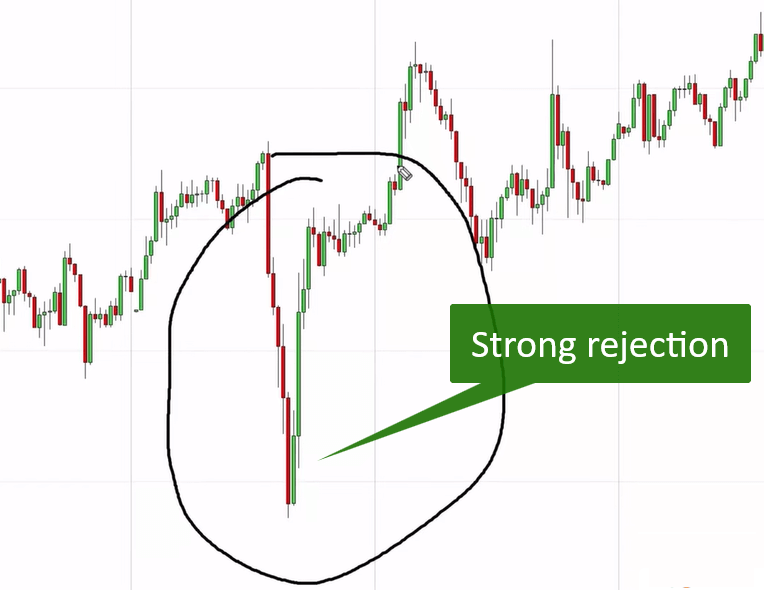
A strong rejection, or a reversal, occurs when the price moves aggressively in one direction and then suddenly snaps back in the opposite direction. These are critical areas because every trader on the planet sees them. Regardless of whether you use RSI, Moving Averages, or pure Price Action, a massive wick on a candle is impossible to ignore. It signals a potential change in trend and the creation of a new support or resistance zone.
However, many traders treat every sharp rejection as a guaranteed entry point. This is the primary cause of trading reversal failure. Without verifying the “engine” behind the move, specifically the volume distribution and price gaps, you are likely walking into a liquidity trap. Institutions often create these moves to entice retail traders into the market, only to reverse the price again and “hunt” their stop-losses. This article provides the filter you need to separate the high-probability winners from the expensive traps.
The 4-Step Reversal Checklist
To stop being the liquidity and start trading with the professionals, you must recognize that a reversal is more than just a shape on a chart. A successful rejection requires a specific sequence of events: a period of balance, a sudden burst of aggression, a footprint of heavy volume, and a structural gap left in the wake of the move.
To filter out the “fake” reversals from the “perfect” ones, I use a strict 4-point checklist. In trading, nothing is ever 100% ideal, so my rule is simple: If 3 out of 4 conditions are met, the trade is valid.
Criteria
Description
Why it matters
1. Market Rotation
Side-ways movement before the move.
Shows balance before the aggressive break.
2. Rejection Strength
Sharp, aggressive “V” shape.
Indicates a strong change in market sentiment.
3. Volume Distribution
Clear heavy volume cluster.
Shows where the “big money” entered the move.
4. Fair Value Gap
An empty space in price action.
Confirms the aggression of the sellers or buyers.
Step 1: Market Rotation Before the Move

The first point on our trading reversal failure 4-step checklist is Market Rotation. Before a valid reversal happens, the market should ideally be moving sideways in a range. This rotation represents a period of “Fair Value” where buyers and sellers are in equilibrium.
When a rejection originates from a rotation, it tells us that the balance has been violently broken. If the price is simply trending and makes a small wick, it isn’t a true rejection; it’s likely just a minor pullback. We want to see a “battle” (the rotation) followed by a “victory” (the aggressive rejection). If you don’t see this sideways movement before the sharp turn, be wary, as you might be looking at a trading reversal failure in the making.
Step 2: Rejection Strength and Aggression
Is the rejection actually strong? This sounds subjective, but it can be quantified. We are looking for a clear “V” or “Inverted V” shape. In my checklist, “strength” means the market participants fled the zone immediately.
If the price hits a high and then lingers there for several candles before slowly drifting down, that is not a rejection, that is consolidation at the highs. A high-quality rejection happens fast. The “rejection tail” should be long and the body of the candles should be large, showing that one side of the market has completely overwhelmed the other. If the move is sluggish or “grindy,” the trading reversal failure risk is high because it suggests there isn’t enough aggressive capital to sustain the new direction.
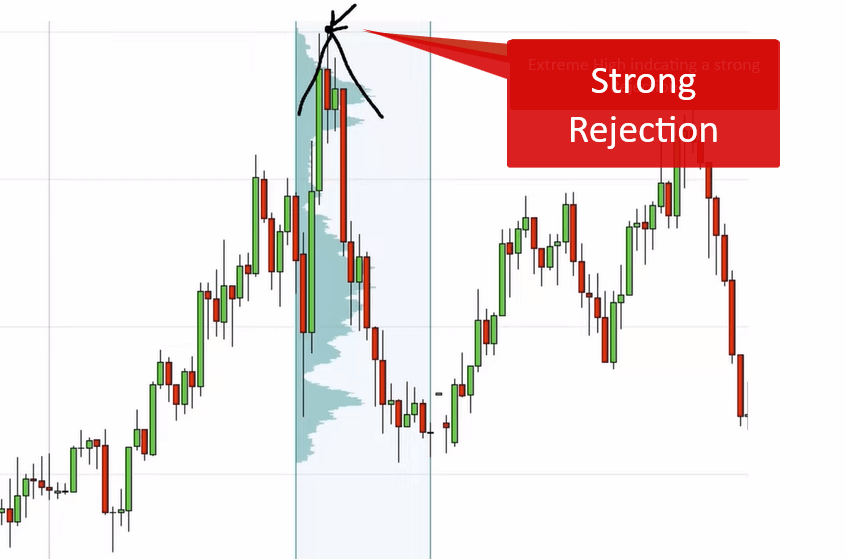
Step 3: Volume Distribution and Clusters

This is the most critical technical step in the trading reversal failure 4-step checklist. To see what is actually happening inside the candles, we use a tool called the Volume Profile. We are looking for two specific features:
- A Heavy Volume Cluster: A specific area within the rejection move where a massive number of contracts were traded.
- A Low Volume Zone: The “tail” or the extreme point of the rejection where very little trading took place because the price moved too fast.
The heavy volume cluster is your “Point of Control” for that move. It is the exact level where the “Big Money” entered the market. If a rejection has no clear volume cluster, it is “thin,” and the price will likely blast right back through it, resulting in a trading reversal failure. We use this cluster as our future resistance or support level.
Step 4: Identifying the Fair Value Gap (FVG)

The final piece of our reversal failure checklist is the Fair Value Gap (FVG). An FVG is a 3-candle structure where the wick of the first candle and the wick of the third candle do not meet, leaving a “gap” in the middle candle.
This gap represents a temporary lapse in market efficiency. It shows that the price moved so aggressively that the market couldn’t facilitate trade for everyone. Ideally, the FVG should start exactly where the heavy volume cluster ends. When these two align—a volume cluster followed by an aggressive gap—you have a “perfect” setup. If there is no FVG, the move lacks the necessary aggression to prevent a trading reversal failure.
How to Execute the Trade Without Getting Trapped
Once you have identified a rejection that passes at least three points on the trading reversal failure 4-step checklist, the next step is execution. The biggest mistake retail traders make is “chasing” the move. They see the rejection, get FOMO (Fear Of Missing Out), and enter at the very bottom or top of the move.
The Entry: The Pullback Method
The “sweet spot” for entry is not the tip of the rejection. It is the Heavy Volume Cluster.
- Identify the Zone: Mark the beginning of the heavy volume cluster on your chart.
- Set a Limit Order: Place your order at the start of this zone.
- Wait: We want to see the price return to this zone. This “retest” allows the institutions to fill any remaining orders and confirms that the zone is acting as new support or resistance.
Protecting Your Capital: Stop-Loss Placement
In the context of a trading reversal failure, your stop-loss is your ultimate insurance.
- Placement: The stop-loss must always go behind the extreme point (the high or the low) of the rejection tail.
- Logic: If the price moves past the tip of the rejection, the “story” of the trade is broken. The rejection has failed, the zone is no longer valid, and you must exit the trade immediately to preserve capital.
Pro Tip: In my 10 years of trading, I’ve found that the market often “retests” these heavy volume zones before continuing the new trend. Patience is your greatest asset here.
Conclusion: Discipline Over Emotion
Success in trading comes down to having a repeatable process. Most traders fail because they trade based on how a chart “feels.” By using the trading reversal failure 4-step checklist, you remove the emotion and replace it with data. You are looking for rotation, strength, volume, and gaps.
If you see a beautiful rejection but there is no volume cluster, don’t trade it. If you see a strong move but no rotation, be cautious. It is better to miss a profitable trade than to enter a bad one because you ignored your rules. Master this checklist, and you will stay on the right side of the market.
FAQ
Q: What is the most important part of the trading reversal failure 4-step checklist? A: While all are important, the Heavy Volume Cluster is the most critical. It provides the actual price level where you should look to enter the trade.
Q: Can I use this checklist for day trading and swing trading? A: Absolutely. This logic is fractal, meaning it works on the 1-minute chart just as well as it works on the Daily or Weekly charts.
Q: Why do I need 3 out of 4 points instead of all 4? A: The market is rarely “perfect.” If you wait for all 4 conditions every single time, you might only find one trade a month. 3 out of 4 provides a high-probability edge while still allowing for regular trading opportunities.
Ready to stop being the liquidity for institutional players?
Stop falling for every trading reversal failure and start trading with professional precision. Join our elite trading course today to unlock my custom NinjaTrader 8 indicators and exclusive video training designed to give you a definitive “unfair advantage.”
Take the next step:
Master the Checklist: Learn to apply the 4-step checklist in real-time.
Get Custom Tools: Gain access to indicators that highlight heavy volume clusters and FVGs automatically.