Do you want ME to help YOU with your trading?
Video Transcript:
Hello, everyone! It’s Dale here
with a new weekly trading ideas video. Just a quick note before I jump into the
trading ideas and charts: there’s an Independence
Day Sale running on my website, which will be ending in two days at the end
of the month. If you go to my website, trader-dale.com,
and click the button, it will take you straight to the page where you can get
my best educational and indicator packs at a discount. The Volume Profile Pack
will teach you everything about volume profile trading, and the Order Flow Pack
will teach you everything about day trading with Order Flow. Both packs also
include all the indicators you will need, including Volume Profile, VWAP, and
Order Flow. If you scroll down a bit, you can get both these indicators
together for a massively discounted price until the end of this month. You can
get the Volume Profile Pack and the Order Flow Pack together for $597.
Remember, the sale will end at the end of July.
Now, let me switch over to the
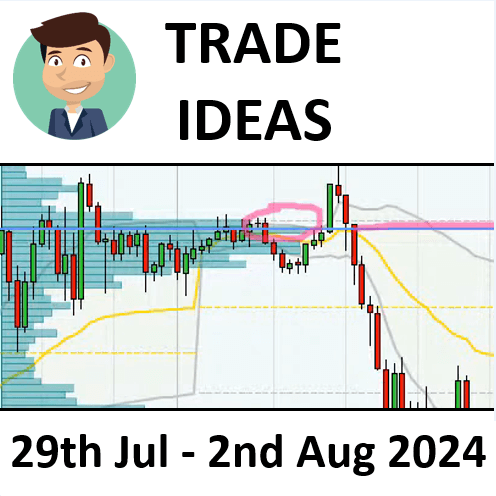
charts and talk about the trading ideas. What you see before you is NinjaTrader
8 platform with my custom Volume Profile and VWAP indicators, and you are
looking at the ES chart, which is the futures for the Standard &
Poor’s 500 Index. This is a 30-minute chart, and I want to talk about a day
trading resistance level here. It is at 5545 and is based on two
factors. The first is a Volume Profile setup within this strong selling
activity. If you look at how volumes were distributed within this selling
activity, you can see a volume bump. While not as significant as other volume
bumps, it is the combination that makes this level strong. This volume cluster
indicates a place where sellers were adding to their short positions as they
pushed the price downwards. Sellers should defend this level, and if the price
reaches this area, they should become active and push the price downwards
again. Additionally, this level is strengthened by the presence of a Fair Value
Gap, which started this aggressive selling activity from the beginning of the
heavy volume zone.
Another aspect that strengthens
this level is that the price previously reacted to this level, marking the low
of the week. This strong reaction indicates that it was a strong support level,
and when the price broke through, it turned into a resistance level. Therefore,
we have three setups: the Volume Profile setup, the Fair Value Gap, and the
support becoming resistance setup. All these factors suggest that this is a
strong level to trade from. To improve your trade entries and exits, you can
use the Order Flow software when the price approaches this level for
confirmation and management of your position. By the way, you can get the Order
Flow software on my website along with the Order Flow trading course.
Now, let’s move on to the next
trading idea, which is on the AUD/USD. This is also a 30-minute chart,
and we see a similar Volume Profile setup as in the ES chart. There was strong
selling activity and a downtrend, and if you look at the volume distribution,
you can spot a nice volume cluster. This zone acted as support in the past and
turned into resistance when the price broke through, which is a price action
setup. The Volume Profile bump indicates that sellers were active here, adding
to their short positions. If the price returns to this level, we can expect a
reaction.
One more thing to note is the
reaction to the weekly VWAP or its first deviation. The gray line represents
the first deviation of the weekly VWAP. When the price is below this deviation,
you can trade pullbacks to it. This approach can be combined with Volume
Profile or price action setups for more robust trading strategies. You can
learn more about VWAP trading in my new VWAP trading course available on my
website.
Next, let’s look at the CHF/JPY
30-minute chart. Again, we see the same setup: a strong trend with significant
volume bumps. The lower volume bump has already been tested, so I’m focusing on
the untested one at 175.183. The logic is the same as in previous
examples: in the downtrend, sellers were active, adding to their short
positions and creating a Fair Value Gap, which shows the aggressiveness of the
sellers. Additionally, there was a strong support level here, which turned into
a resistance level, confirming the Volume Profile setup.
Before wrapping up, I’d like to
announce the winner of the last contest. The prize was my custom-made Volume
Profile and VWAP indicators for the TradingView platform. Congratulations to
the winner, whose name is displayed on the screen! We’ll have another contest
next week. To participate, leave a comment below the video, which I’ll publish
on YouTube. Next week, I’ll randomly pick one person to win this set of
custom-made indicators.
Thanks for watching the video, and
I look forward to seeing you next time. Until then, happy trading!