Hello guys,
in today’s day trading analysis I am going to focus on AUD/CAD.
The reason being is a nice “Volume Accumulation Setup” that I spotted there, on a 30 Minute chart.
Volume Profile Setup
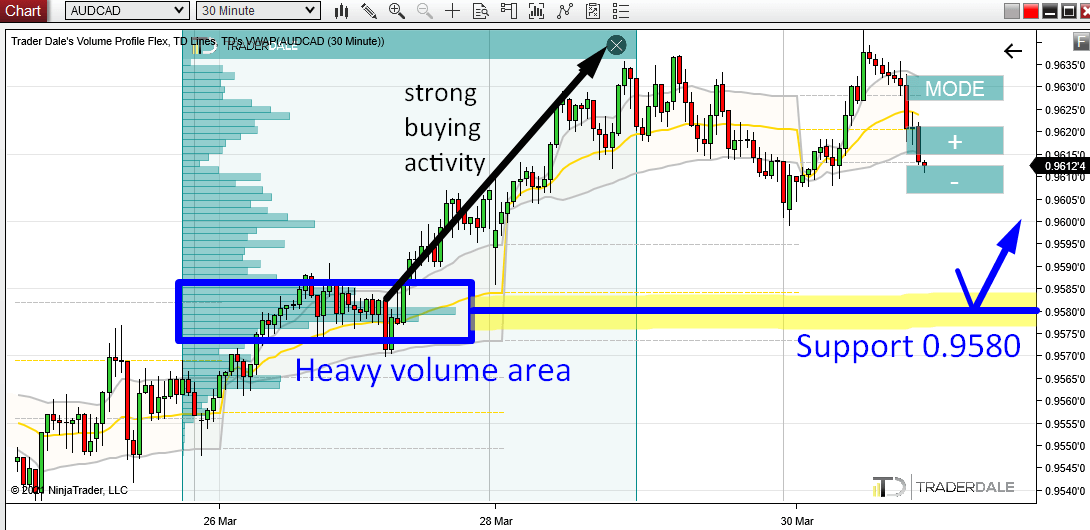
On Friday, there was a rotation, from which an uptrend started (=strong buying activity).
This is a typical scenario the Volume Accumulation Setup is based on: First, a rotation and then a strong trend development – that’s what you want to see!
This tells us one thing – strong Buyers were building up their Long positions in that rotation. Slowly, unnoticed. When they have accumulated their positions, they started to push the price upwards aggressively.
How do we tell that there were heavy volumes accumulated in that rotation? By using the Volume Profile indicator!
AUD/CAD; 30 Minute chart:

This is a piece of information we can work with!
When the price makes it back into this heavy volume area we can expect those Buyers to defend this zone. It is important for them because they placed a lot of their Longs there. They won’t let the price shoot past this area without a fight!
This is the reason, why I think this zone around 0.9580 will work as a strong Support in the future. Now we just need to wait until the price reaches it.
Price Action Setup
As you probably know, I like to combine trading setups. The more trading setups point to a a trading level, the better.
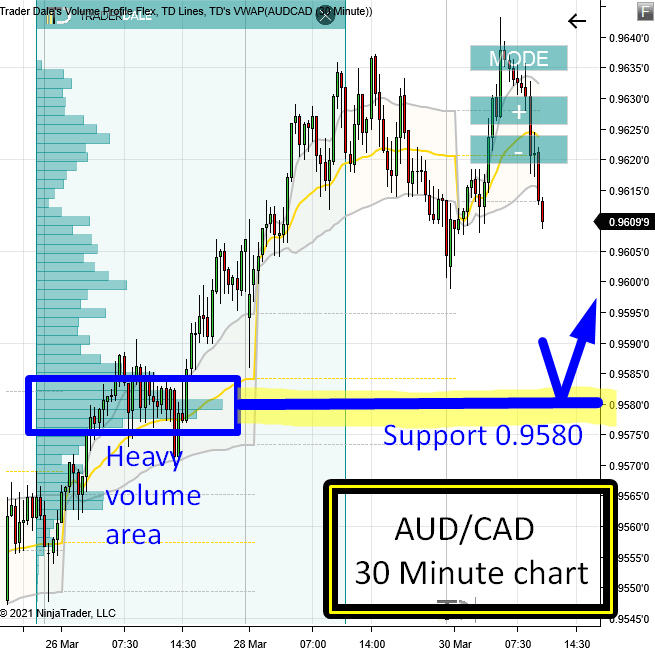
In this case, there is a Price Action trading setup that nicely confirms our 0.9580 Support.
The thing is, that this 0.9580 Support zone worked as a Resistance in the past. You can tell because the price bounced away from this zone strongly before (on Thursday).
Then, on Friday this Resistance got breached.
When a Resistance gets breached, it then becomes a Support. This is an old Price Action setup I like to use.
I would not trade this as a standalone setup. However, the cool thing about this is that in this case, the newly formed Support nicely aligns with the Support we found using Volume Profile. That Support around 0.9580.
See? Nice combo of two trading setups. One is based on Volume Profile, the other on Price Action. Two independent setups point to the same Support.
AUD/CAD; 30 Minute chart:

It’s the combo of the two trading setups that makes this support strong!
I hope you guys liked today’s analysis. Let me know what you think in the comments below!
Happy trading,
-Dale


Hello
I have a question, please help.
I follow you on YouTube. The AUDCAD currency you analyzed used a flexiblevolume profile .
My question is that you used Forex and it is not data futures and you use Forex data broker?
Because I could not find AUDCAD in the ninja trader in the futures market, and because I wanted to use the volume profile and footprint.
Thank you
Hi Alireza,
AUD/CAD is a spot forex contract, not a futures contract, I’m not sure what’s your question? For forex datafeed I use FXCM, and for futures datafeed I use Continuum datafeed. They are both available on Ninja.
You just have to search it under forex instead of futures. 🙂
If you’ll have further questions on this theme please reach me on my email: contact@trader.dale.com
Cheers!