In my yesterday’s article, I showed you how I look for confluences of trading setups to identify strong supports and resistances. If you missed the article, then you can read it here:
EUR/CAD: Volume Profile + VWAP Daily Analysis
Because practice makes perfect, I will do a very similar analysis today. This time I will focus on AUD/CHF.
Volume Profile setup
The first thing that caught my eye here today, was a rotation and a strong buying activity starting from it. This is usually a sign of buyers who were building up their positions in the rotation, and who aggressively pushed the price upwards later.
I used my Flexible Volume Profile to look into the most recent area to see how the volumes were distributed there. I saw what I expected – heavy volumes accumulated around 0.5853.
Heavy volumes make this area a support. When the price makes a pullback into this area again, then the buyers who were building up their positions here should try and push the price upwards again. They will do so because they will want to defend their long positions.
Check it out on the picture below (AUD/CHF; 30 Minute TF):

The Special Webinar -50% Sale ends this Friday 27th. You can get it here:
Price Action setup
Apart from the setup I mentioned above, there is also a Price Action setup I like to trade. This setup says that a breached support becomes a resistance (and vice versa). I identify old supports and resistances by simply looking at the charts looking for significant swing points. Those were old supports/resistances.
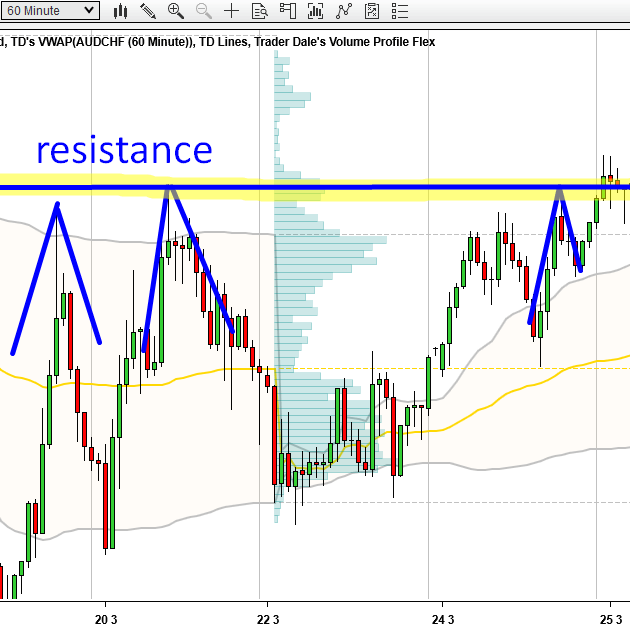
If you look at the picture below, you can see that there were three such swing points very close to the 0.5853 level. I marked those swing points in blue. This shows that the price jumped off the same area three times in the past and therefore, I consider it a resistance. This resistance got broken and the price went past it today. This means that the former resistance has now become a support.
You can learn more about this setup here:
Price Action Strategy: Support Becoming Resistance
Below is a 60 Minute chart of AUD/CHF:

VWAP setup
Apart from the Volume setup and the Resistance → Support setup, there is also one more setup forming.
It is the VWAP Trend setup (the #2 setup I showed at my recent VWAP webinar).
If you look at the picture above, then you can see that the 1st VWAP deviation is moving upwards (I am using the Weekly VWAP). This tells me that the volumes are shifting upwards and that there is an uptrend. In a situation like this the 1st deviation should work as a support. The deviation is being calculated in real time and if the price comes back to the 0.5853 area soon (for example today or tomorrow), then I think there is a good chance it will meet with the 1st Deviation – which could by that time make it to this level (I indicated it in the chart). This would make another nice confirmation.
As you can see, we have 2, possibly 3 trading setups which confirm each other. This is what I like to see and trade.
I hope you guys liked today’s analysis. Let me know what you think in the comments below!
Stay safe and happy trading!
-Dale