Today’s buying on the AUD created some nice trading opportunities on the AUD related pairs. Like for example on the AUD/CHF which I am going to analyze in this article. I am going to focus on an intraday analysis using 30 Minute and 60 Minute charts.
When there is a trend like now, I always use my Flexible Volume Profile indicator to look into the trend. What I am interested in most are places where heavy volumes got traded. I call those places “volume clusters“.
Volume Clusters
Volume clusters are a sign that buyers or sellers were adding or building up their trading positions. If there is an uptrend like in this case, then it was buyers who were adding to their long positions. They wanted to make most of the uptrend.
When the price makes it back to those volume clusters then it is likely that they will work as support zones. Why? Because those buyers who accumulated their longs in the volume clusters will want to defend those areas.
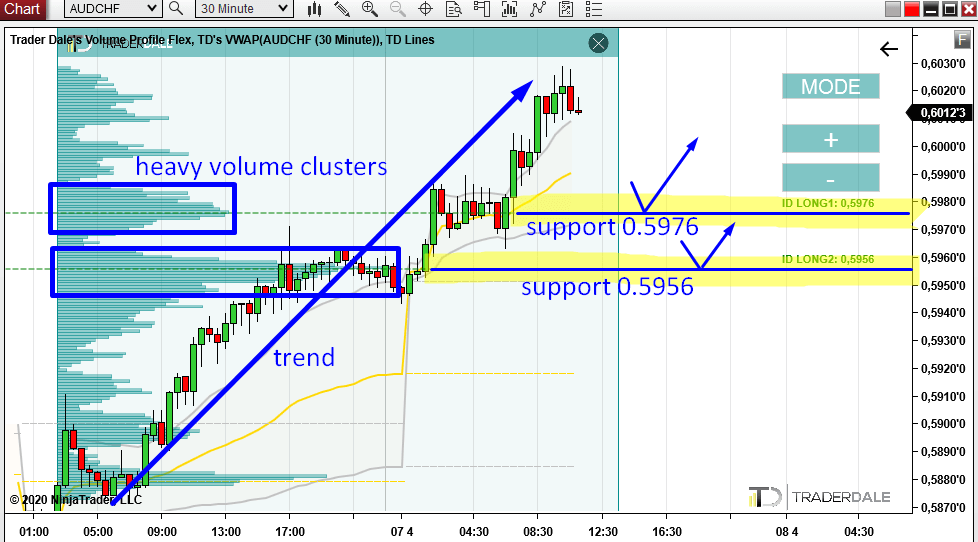
Below is a 30 Minute chart of the AUD/CHF where you can see two significant volume clusters. Both make a nice volume-based supports. The first is at 0.5976 and the second is at 0.5956. When the price makes a pullback to them then the buyers should step in and push the price upwards again.

Resistance becoming a Support
There is also a very nice confluence which I always like to see with this Trend setup. The confluence is at the 1st support (0.5976).
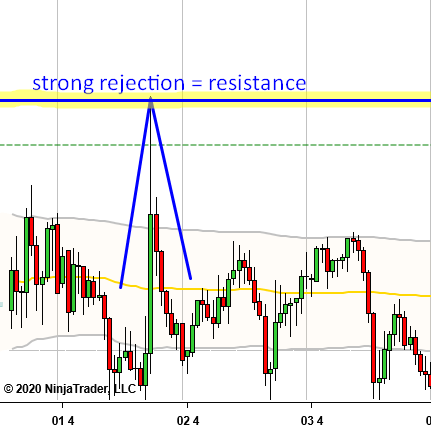
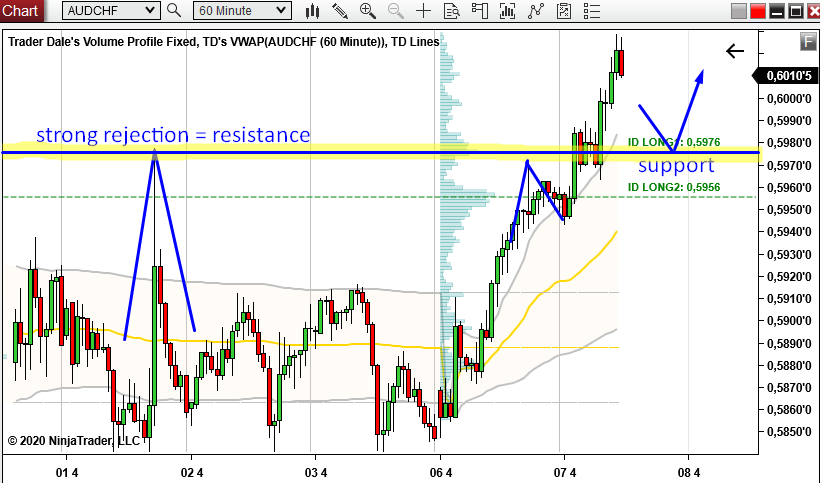
The picture below shows the same chart, now with 60 Minute time frame. As you can see, there was a really strong rejection of this price level in the past. The price reacted to this level aggressively and it is pretty obvious that this level worked as a strong resistance.
On Monday the price reacted to this level again. Not so strongly this time but the reaction was there.
Today the price went past this twice tested resistance. When it did the resistance became a support. This is quite old but working price action setup and you can learn some more about it in here:
Resistance turns into Support (and vice versa)
What I like about this is that this setup points me to the same level as the 1st volume cluster (0.5976). That’s a nice confluence I am always happy to see and trade.
Do you want ME to help YOU with your trading?
Yesterday’s trades
Did you watch yesterday’s Weekly Trading Ideas Video I posted here? Two levels I was talking about got already hit.
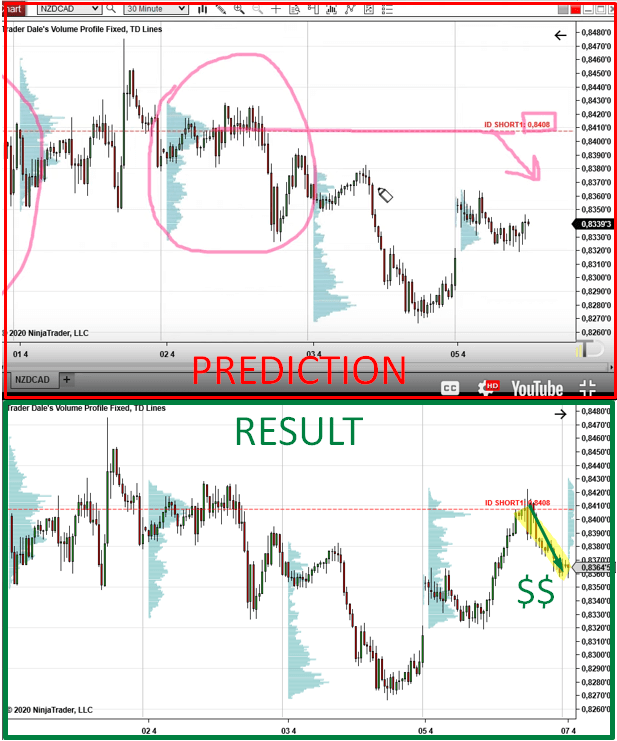
The first one was on the NZD/CAD. Below is the prediction from the video and the result:
The second level that got already hit was on the CHF/JPY. The reaction to it was not as nice as on the previous pair but still if you took the trade for example with 20 pip TP and 20 pip SL then it would turn out a nice winner.

I hope you guys liked today’s analysis! Let me know what you think in the comments below!
Stay safe and happy trading!
-Dale