Do you prefer a video? Check this out:
This article is a part of a four-part Beginners Guide to Order Flow. Here are links to all parts:
ORDER FLOW DEFINITION: Order Flow is an advanced charting software which enables you to read all trading orders that are processed in the market. It helps to track the BIG financial institutions through the trades they make.
Most people get confused when they open up a chart with Order Flow for the first time. There is no shame in that. Order Flow shows so much information and it is easy to get overwhelmed and confused if you don’t know what to look for!
This Beginners Guide will break down how Order Flow works, and how you can start using it your trading today!
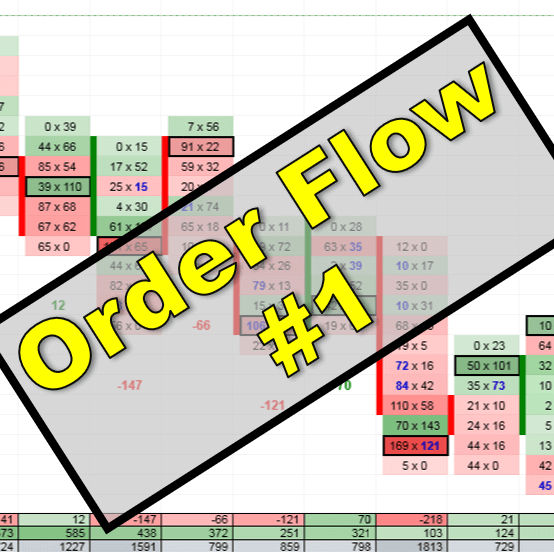
In this 1st part of the Order Flow Guide I will show you around the Order Flow interface.
Footprints
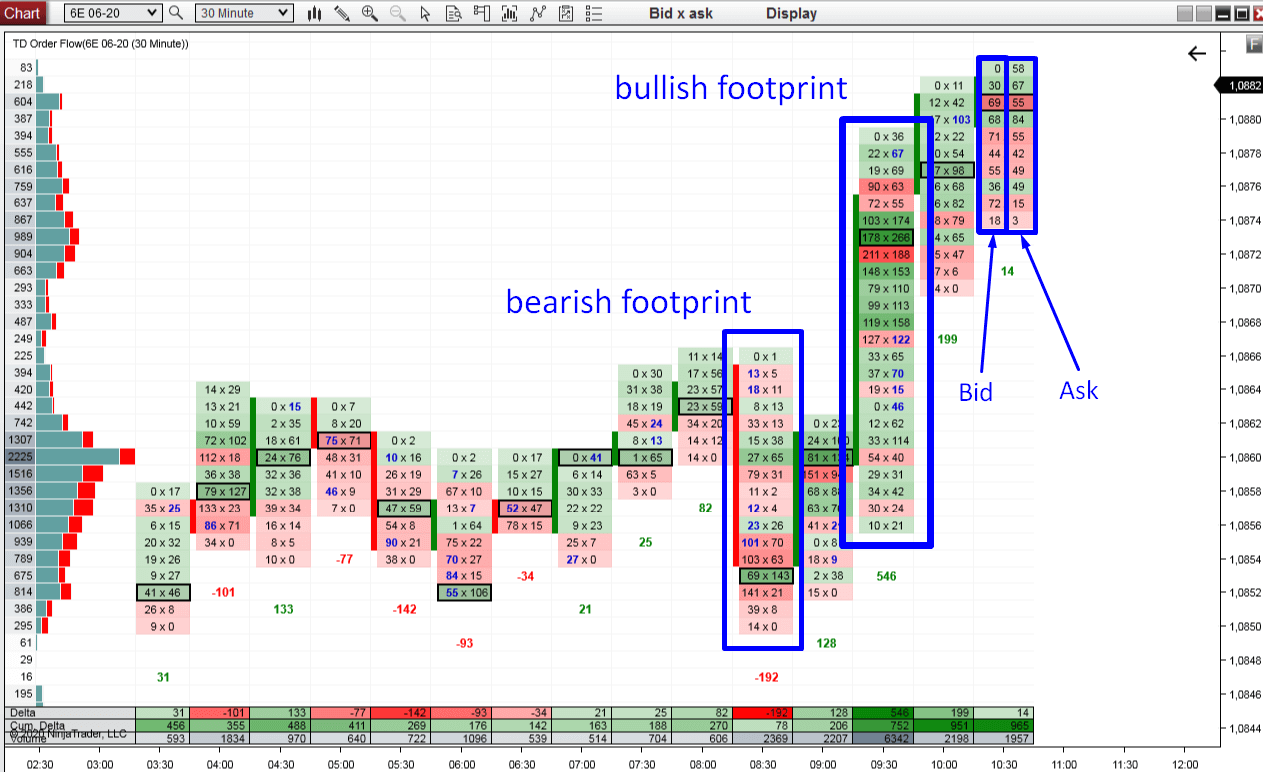
The Order Flow does not show standard candles, but it shows FOOTPRINTS.
A footprint shows not only Open, High, Low, Close (as standard candles) but it also shows orders traded in that candle.
Orders can be placed on Bid or on Ask.
When a BUYER enters a long position (with a Market order), then his order shows on the ASK side of the footprint.
When a SELLER enters a short trade (with a Market order), then his order shows on BID.
This is how the Order Flow chart is drawn.
Green/Red Cells
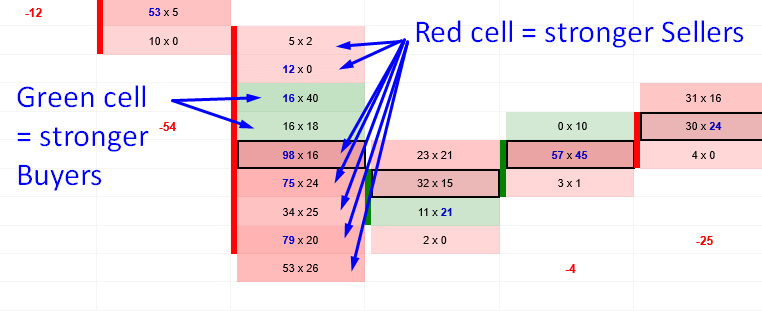
Inside every footprint there are green or red cells.
The cell is GREEN if the number on Ask is larger than that of the Bid.
It is RED when the Bid is larger than the Ask.
This represents the strength of Buyers versus Sellers.
For this reason, the bullish footprints are primarily green (stronger buyers) and the bearish footprints are primarily red (stronger sellers).
Recommended Forex Broker
High Volume Nodes
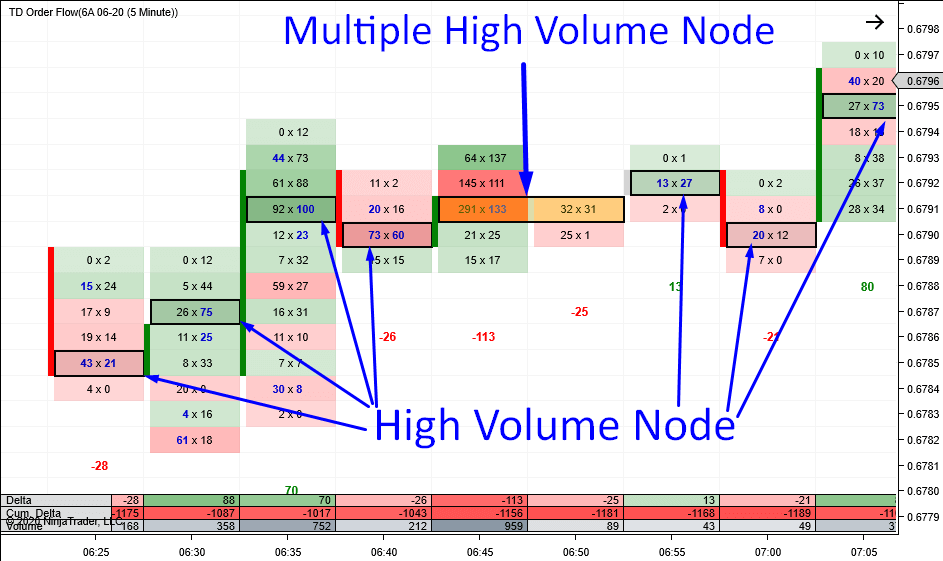
Possibly the most important place in any footprint is the High Volume Node. It represents the place where the heaviest volumes were traded.
It is marked by a black outline, making easily visible at first sight.
If there are more Heavy Volume Nodes exactly at the same price, in two consecutive footprints, then they are highlighted in yellow. Price levels like these represent a support/resistance zone.
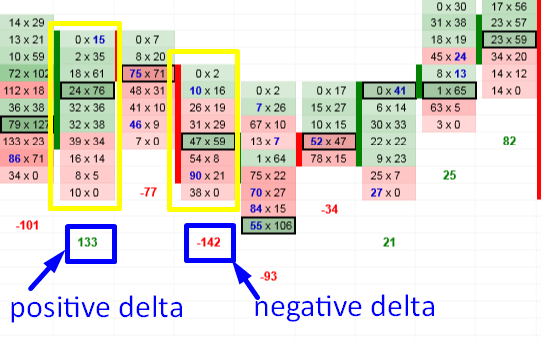
Delta
Below each footprint, there is a number which is either green or red.
It is GREEN (positive) when there are more trades executed at the Ask (in that whole footprint).
It is RED (negative) when there are more trades executed at the Bid (in that whole footprint).
This basically tells you who is stronger in that footprint – whether buyers or sellers.
Footprint Summary
The panel at the bottom shows summary of each footprint.
You can set it up any way you want so it shows the information you need to keep track of with your strategy. It is best not to have too much summary info there and only focus on a the most useful things.
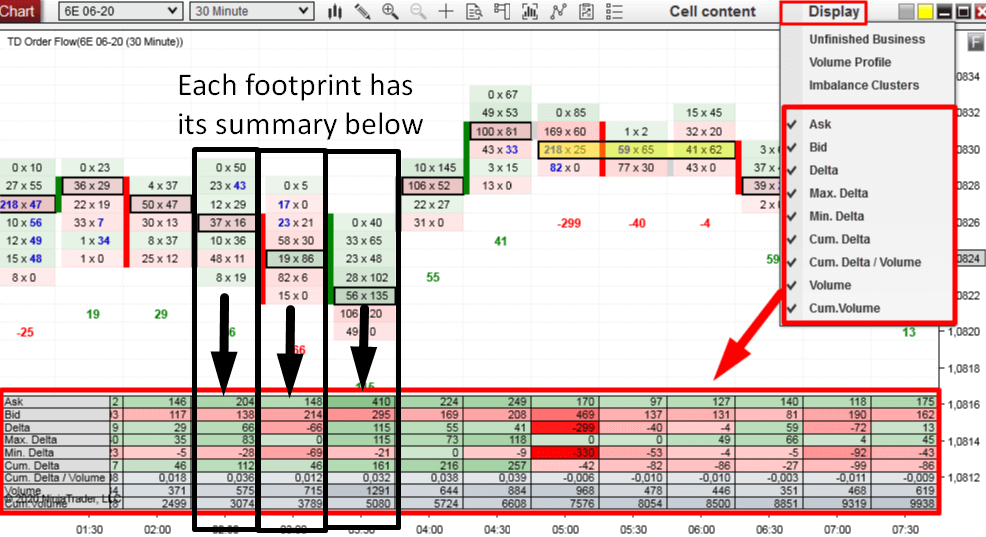
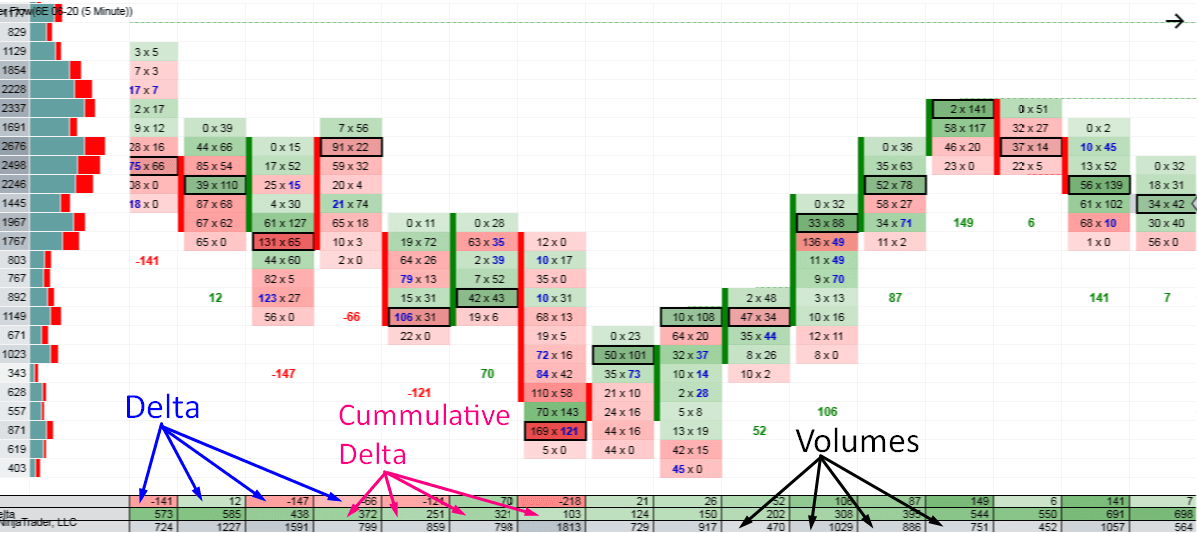
I personally like to use only Delta, Cumulative Delta and Volume.
Delta shows whether there were stronger Buyers or Sellers.
Cumulative Delta shows delta changes throughout the whole day.
Volume shows the overall volume of each footprint.
The screenshot below shows my Summary settings:
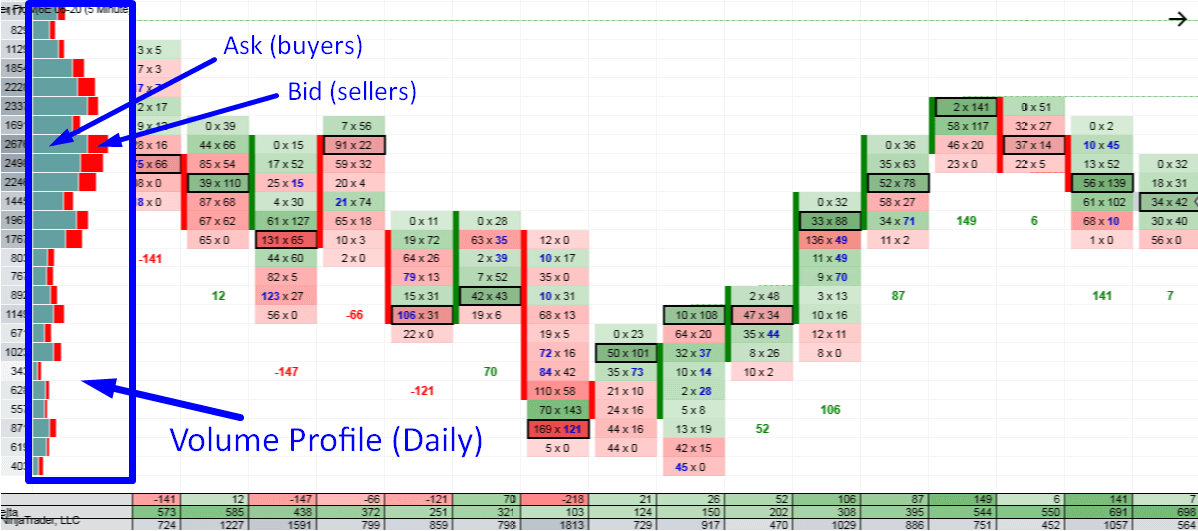
Volume Profile
My Order Flow software also has its own Volume Profile.
It is a Daily Volume Profile which shows the volume distribution throughout the whole day.
This is really important feature because it shows you the bigger picture, which is critical when trading with the Order Flow!
The BLUEISH/GREEN color on the Volume Profile represents orders traded on Ask (Market Buy orders) and the RED color represents orders traded on Bid.
Where to get Order Flow?
You can get my custom made Order Flow here:
TD Order Flow Software & Training – Click Here
You can get it as a part of OF Package which consists of:- Order Flow software
- Order Flow Video Course (12 hours long)
- Volume Profile Pack
This article is a first part of a four-part Beginners Guide to Order Flow. Here are links to all parts:

How much is the order flow package. What is the discount members bought volume software?
Hello,
you can see the current price of the OF package here: https://www.trader-dale.com/order-flow-indicator-and-video-course/
There is a discount for members who have one of my educational packs. If you want to know more please send me an email to: contact@trader-dale.com
Hi,
To run the order flow software On Ninja Trader, can you use the free Ninja Trader or do you need the paid one. Thanks
Hello Dale, it is my same question (Taryn’s)
Hello, sure you can. No problem there! Use their free version.
-Dale
Hi all,
One point to note is the ‘free’ version of NT8 does not include volume/tick data. NT8 is a platform only. You still need to subscribe its data feed (by various data provider, e.g. CQG). Hence, it is not simply buy this software without any additional cost.
Hi,
I explain how to get free data connection at part 4 of this guide and also in my courses, so there are no any additional costs.
is this included w NT8 lifetime ?
They have their own OF, but I don’t think it is nowhere as good as mine. Also it is more expensive and they don’t provide training as I do.
Does order flow package include Volume profile training course?
Hello, yes it does!
will your order flow work on ninja trader 8 platform
Yes, it was developed for NinjaTrader 8.
good day, Dale. I understand you do forex, I am trading stock incl options. I mainly operate on the dutch index AEX. Would your software help me on index/stock trading? Volume profile I have on TradingView yet I am looking for the supportive Order Flow. Thank you and you are a very good teacher IMHO
Hello Piet,
thanks for your message!
Sure my software will work with indices, only think you need to make sure is you have the datafeed for that. You need datafeed that gives you Bid and Ask. Since you have a pretty specific trading instrument in mind I recommend emailing NinjaTrader support. Tell them what you need (what instrument and that you want Bid and Ask data) and they will tell you exactly what datafeed you will need and the cost of it.
Have a day,
-Dale
hi dale
can we do india NSE stocks and future trade with order flow ?
Hi Siraj,
Yes for sure. My order flow software works on every market profile.
For NSE, I also have a special video for my Indian followers/members
https://www.youtube.com/watch?v=SfUZDcXtsbU
Hey Dale
Do you still teach us how to get free data feed connection ? Is that still possible? If I get your software do u still offer free setting up of everything?
Hello, yes thats correct!
Dale,I noticed that you said CQG datafeed for futures is $5.Is tis correct?
Hello, yea there is a guide in my members area.
Hey Dale. I trade stock options. I don’t mind using my current brokerage platform for the trading but can I analyze US stocks on NinjaTrader 8 without having to pay for any data feed?
שלום לך חבר יקר
האם התוכנות שלך יכולות להיתחבר לtradingview
או שאצטרך לסחור רק ב ninja trader
אשמח לדעת
תודה