This article is a part of a four-part Beginners Guide to Order Flow. Here are links to all parts:
- Beginners Guide to Order Flow PART 1: What Is Order Flow?
- Beginners Guide to Order Flow PART 2: Special Features
- Beginners Guide To Order Flow PART 3: Trading Strategies
- Beginners Guide To Order Flow PART 4: Platform, Data, Instruments
In this article, I will show you some Order Flow trading strategies. First, we will break down two strategies that are based solely on Order Flow. Next, I will show you how to use Order Flow to confirm and improve your trade entries.
Trading Strategy #1: Volume Clusters
This strategy is based on trading significant areas of heavy volume. These volume areas are places where the BIG guys (institutions) and their trading algorithms placed/filled a large portion of their orders. The exact steps to follow are:
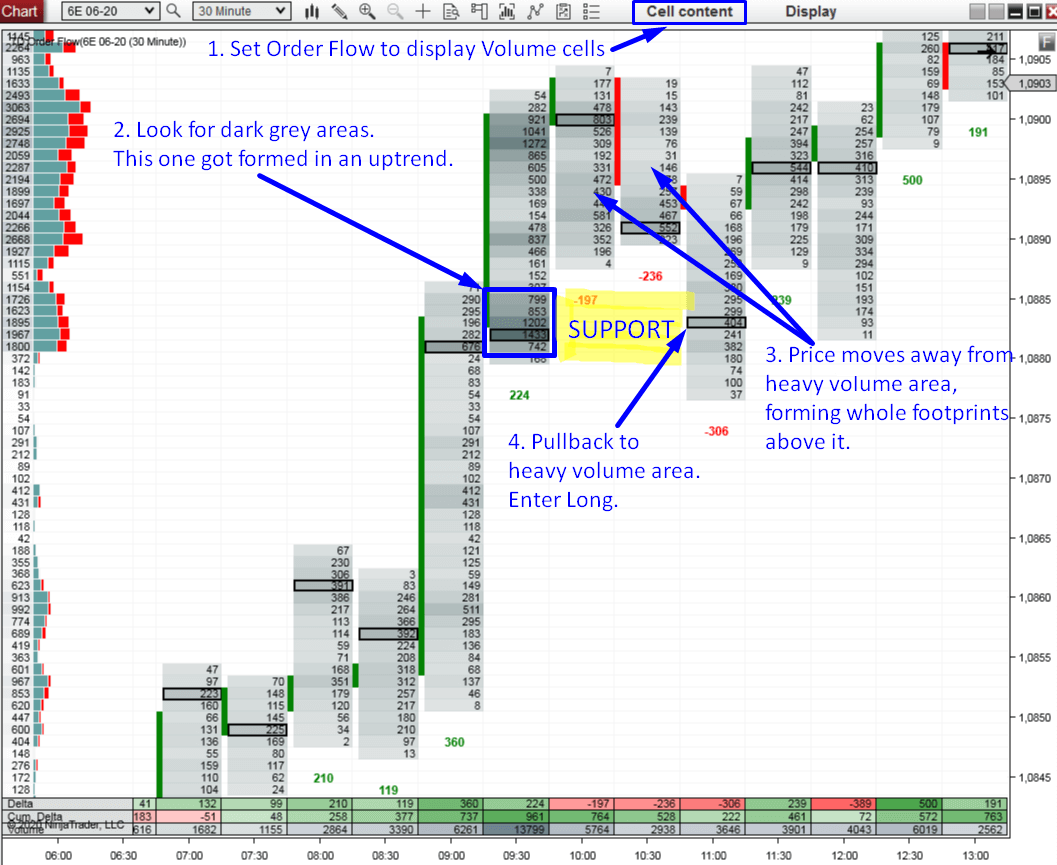
- Set your Order Flow software to show Volumes (not Bid x Ask). This will make it way more easier to identify heavy volume zones. The Order Flow will show in shades of grey and heavy volume areas will stand out (darker shades).
- Look for dark grey areas (heavy volume areas) that stand out. Those show heavy volumes (institutional activity). The best place to look for those is within a trend or in a strong rejection of higher/lower prices.
- You need to see the price move away from the heavy volume area making at least one or two whole footprints (candles) above or below this area. I like to use 30 Minute footprints for this.
- Then you need to wait for a pullback. When the price returns back to this heavy volume area, then you enter your trade.
- Your trade entry should be at the beginning of the volume cluster or at the place where the volumes were the heaviest (within that volume cluster).
- If the heavy volume area was formed in an uptrend, then you go Long. In case it was formed in a downtrend, then you go Short.
- If the heavy volume area got formed in a rejection of lower prices, then you go Long (in the direction of the rejection). In case there was a rejection of higher prices, you take a short trade.
Example of Volume Cluster created in an uptrend. Instrument EUR futures, 30 Minute chart:
Example of Volume Cluster created in a rejection. Instrument EUR futures, 30 Minute chart:
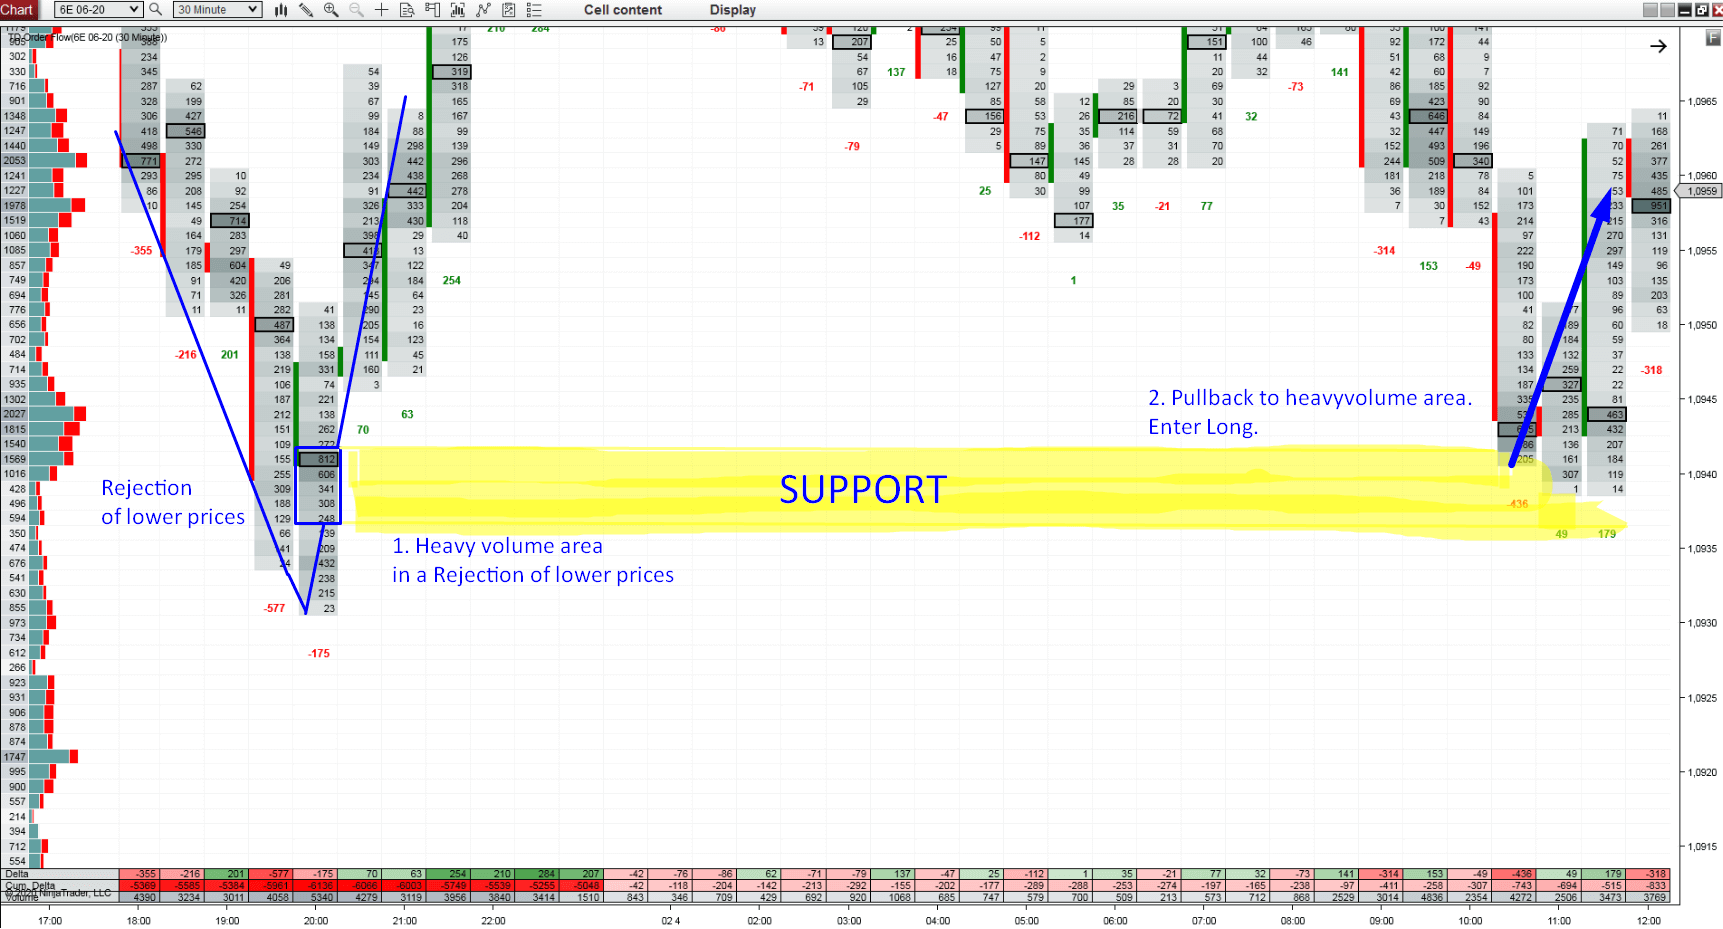
The reasoning behind this setup is simple. Smart Money was entering their positions and then they pushed the price their way. A pullback to this area is an opportunity for us as smart money will most likely want to defend their previously entered positions. Because of that, these high volume areas represent a clear level of support/resistance.
Recommended Forex Broker
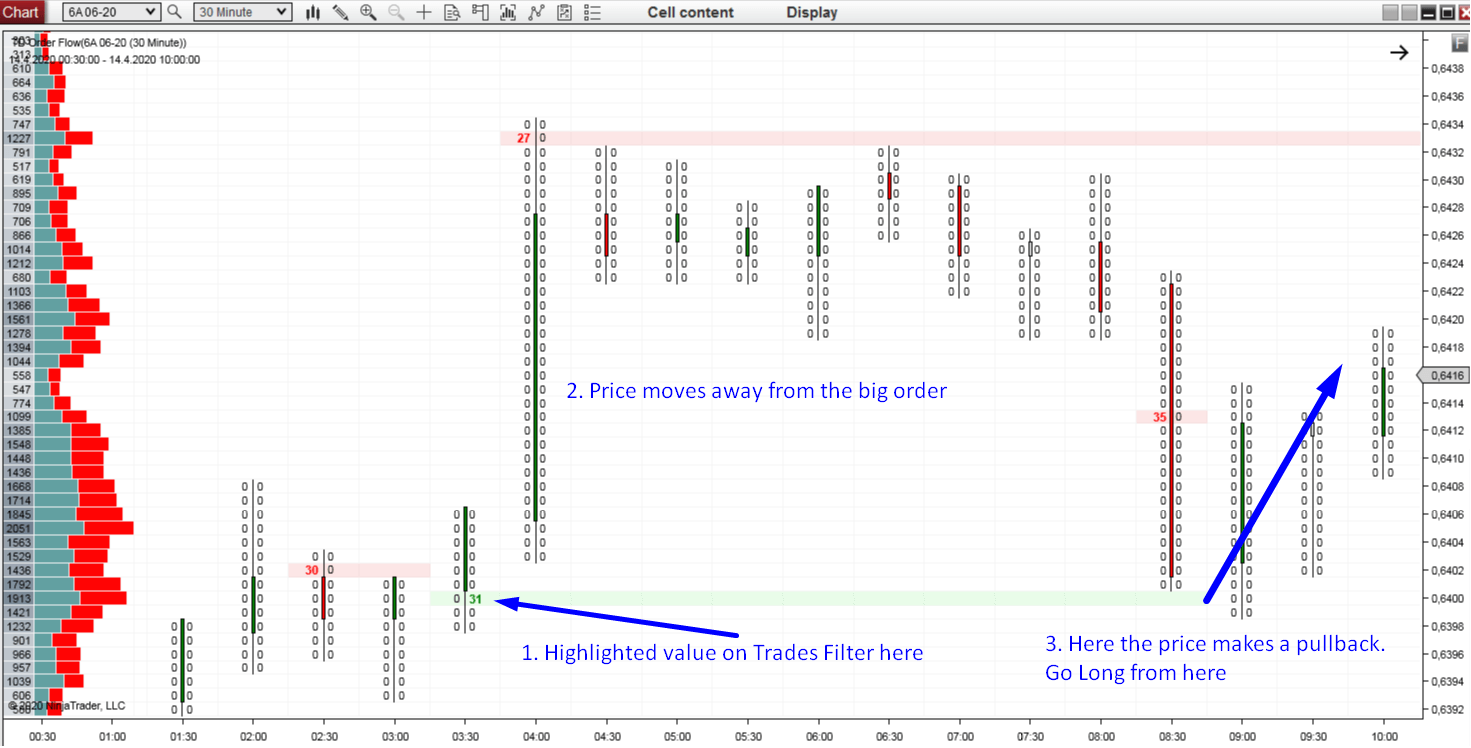
Trading strategy #2: Trades Filter
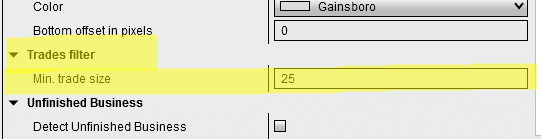
Trades Filter is a unique feature of my Order Flow software. It enables you to filter-out the noise from the market and to display only the largest trading orders (the BIG guys). This strategy is based on following those big orders.
In the indicator settings you can set the Trades Filter to show only trades bigger than X lots. In the picture below I set the filter to 25, which means it will only show trades with more than 25 lots.
The strategy is very similar to the previous strategy (Volume Clusters). Here are the steps:
- Set your Order Flow to show BID x ASK. Then enable the Trades Filter in the indicator settings and set minimum trade size. For EUR futures I use 25 lots.
- Look for highlighted values (red/green) on the trades filter. Those are big trading orders and they work as strong Support and Resistance zones.
- You need to see the price move away from these areas first, making at least one or two whole footprints (candles) above or below this area. I like to use 30 Minute footprints for this.
- Then you need to wait for a pullback. When the price returns back to this big order area, then you enter your trade.
- If the price hit this area from above, then you enter Long. If it makes a pullback from below, then you go Short.
The example below shows AUD currency futures, 30 Minute chart with Trades Filter ON.
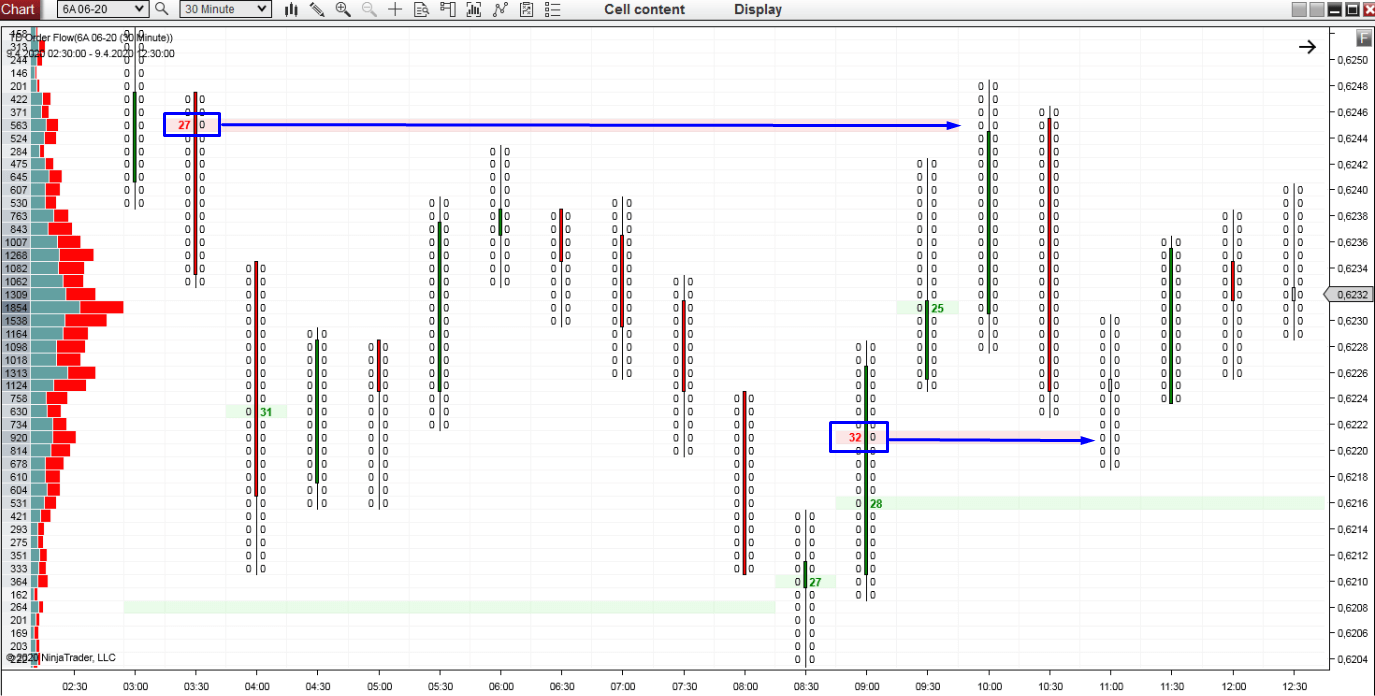
Another example below shows two more possible trade entries based on the Trades Filter strategy:
Confirmation Strategies
A Confirmation is best used around strong Support/Resistance zones which you found using your main strategy. For me that would be strategy based on Volume Profile.
This is how it works:
First, I go through the chart and analyze it with Volume Profile. When I find a Support or a Resistance I mark it in the chart. I then wait until the price makes it to this area. When it does, I switch to Order Flow and I wait for a confirmation. After a valid confirmation I enter the trade. There are many possible confirmations that will give you the final signal to enter your trade. In this article I will show you two of them. Confirmation by Limit Orders, and Confirmation by Absorption.
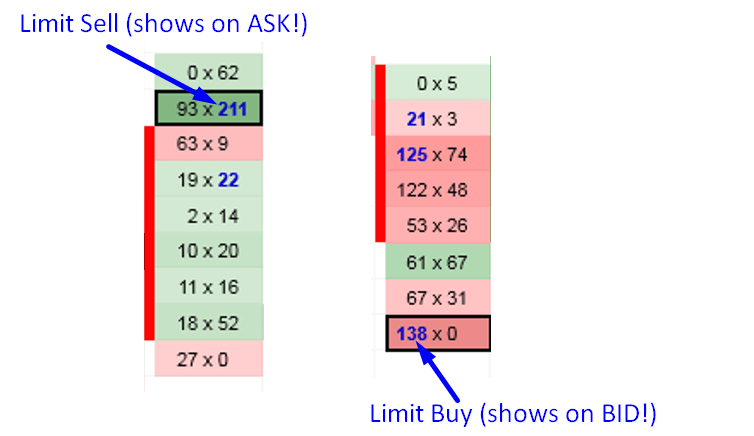
Confirmation strategy #1: Limit Orders
When the price reaches a strong Support/Resistance zone you want to see a sign that it will react to this zone. This sign could be some BIG guy/institution jumping in the market around that zone.
You want to see somebody big who has been waiting there (as well as you have been) to jump in the trade. When traders wait for the price to come to them, they use a Limit Order. They don’t chase the market with aggressive Market Orders. A Limit Order is better because they get filled for the price THEY want.
The Limit Confirmation Strategy is simple. You would identify a significant S/R zones and then wait for somebody big to jump at this level using a Limit Order.
When there is a Resistance, you want to see a Limit Sell order appear. When trading around a Support zone, you want to see a Limit Buy.
Now here is a tricky part so read this carefully:
A Limit SELL shows on ASK.
A Limit BUY shows on BID.
It is tricky because it is exactly the opposite as with Market Orders. For the purposes of trading this strategy it is enough to just know and understand that point. If, however, you would like to learn more about it you can watch my Order Flow webinar here: Volume Profile & Order Flow Webinar. Additionally, you can learn about it in detail in my Order Flow Video Course.
Steps to Limit Orders confirmation strategy:
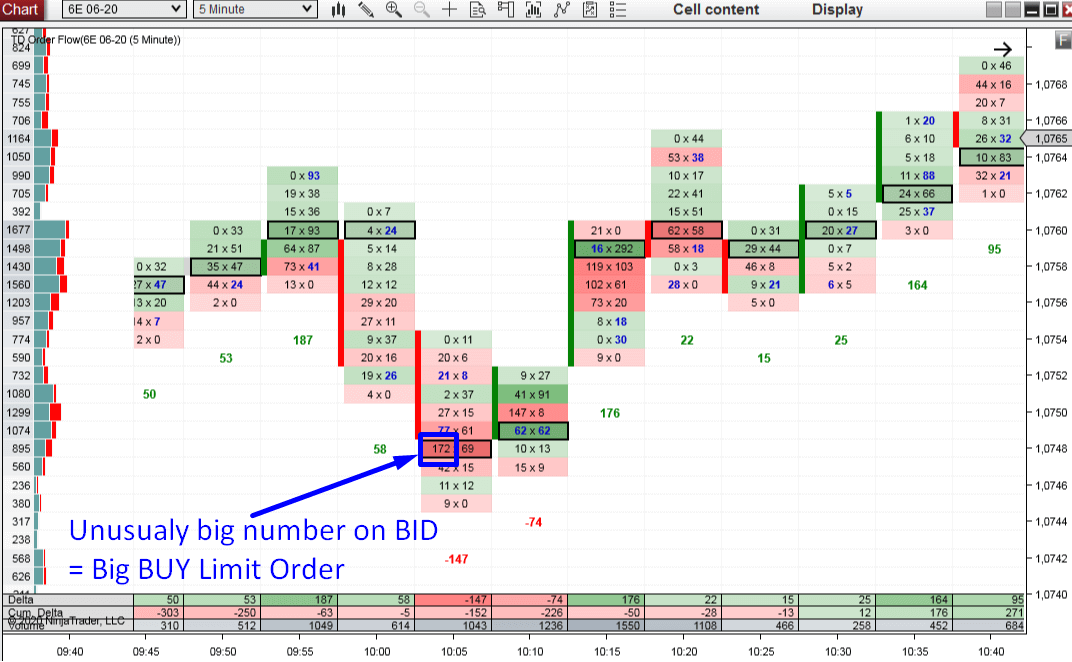
1. Identify strong Support/Resistance zone using your main strategy (this could be Volume Profile strategy, Price Action strategy,…).
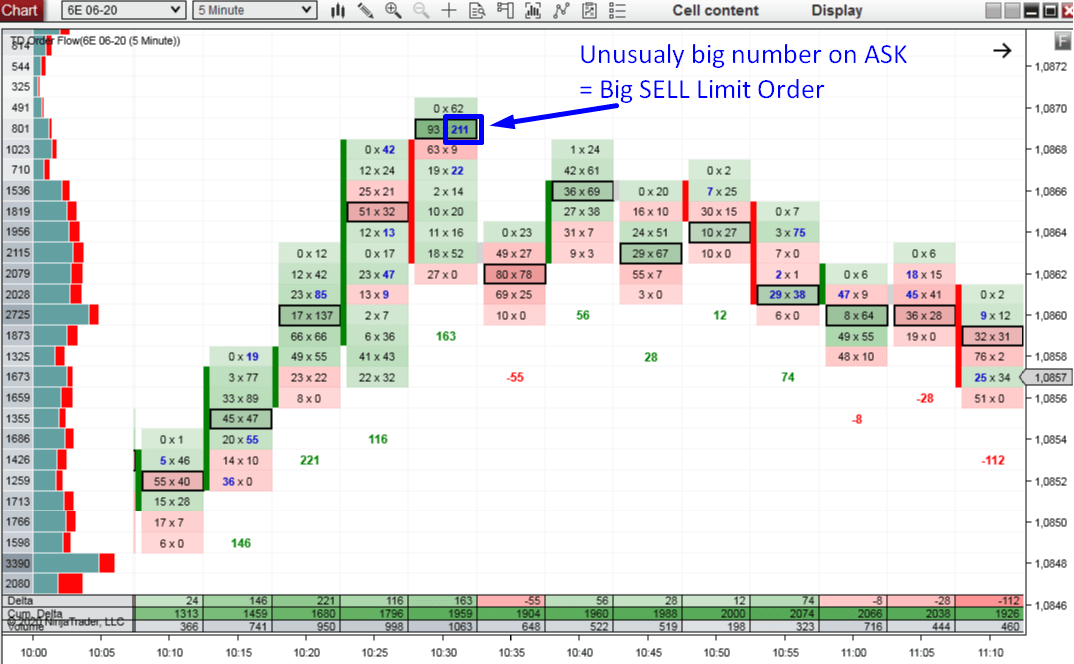
2. When the price gets near that zone, open Order Flow and wait for a big Limit Order (unusually big volumes) to appear. For a Short trade confirmation, you want to see a big number on ASK. For a Long trade confirmation it needs to appear on BID.
With this confirmation I like to use 5 Minute chart.
3. Enter your trade as soon as you identify the big Limit Order. Sometimes it does not appear all at once and it may take a few minutes until the whole big order is placed.
Below is EUR futures, 5 Minute chart, showing a Long trade confirmation.
Below is EUR futures, 5 Minute chart, showing a Short trade confirmation.
Confirmation strategy #2: Absorption
This confirmation strategy is a bit similar to the Limit Order strategy, though, a bit more simple.
In this case, the confirmation on the Support or Resistance is buyers or sellers who absorb all the pressure.
Imagine for example, that sellers are pushing the price downwards. They are entering aggressive Market Sell orders which push the price down. When strong buyers appear, they absorb all the selling orders. The price does not drop anymore and heavy volumes start to appear. Those heavy volumes appear on BID (aggressive sellers) as well as on ASK (aggressive buyers).
So, when you see that there are unusually large volumes traded on the BID and ASK around some S/R zone, then it is most likely Absorption. The pressure is getting absorbed and the price is likely to turn. That’s the confirmation you want to see!
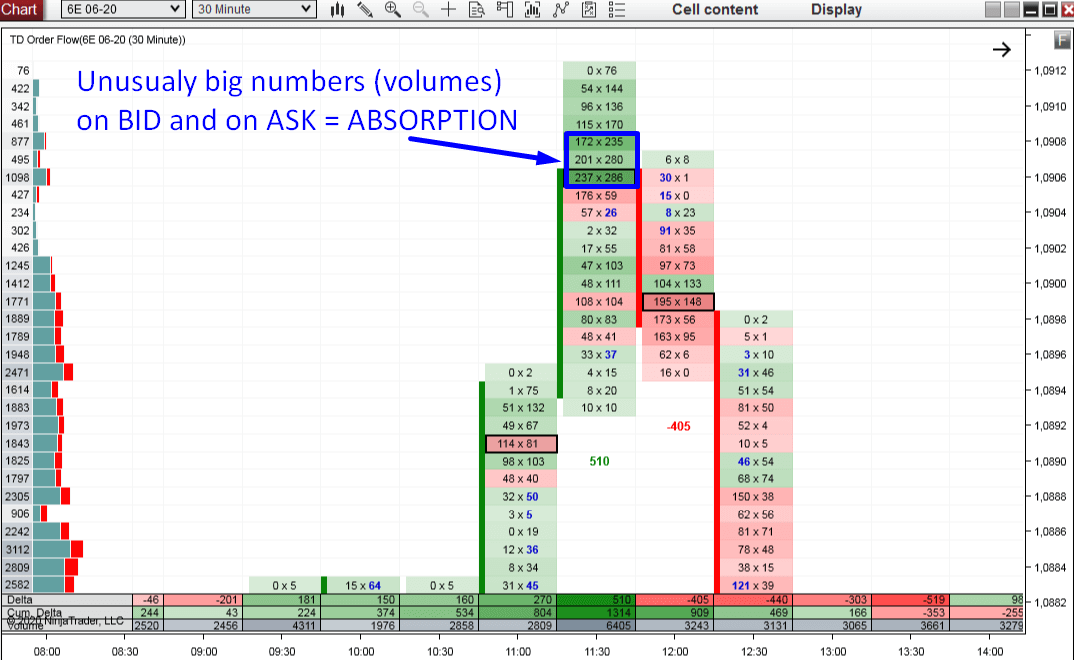
Steps to the Absorption Confirmation Strategy:
1. Identify a strong Support/Resistance zone using your main strategy (this could be Volume Profile strategy, Price Action strategy,…).
2. When the price gets near that zone, open your Order Flow chart and wait for unusually heavy volumes appear on the BID and ASK. For this, I like to use 5 Minute chart. As previously stated, the absorption needs to appear around the S/R zone.
3. Enter your trade as soon as you identify the Absorption. It may take a few minutes until all the orders on BID and ASK are placed and you safely identify that market is absorbing the buying/selling pressure.
EUR futures, 30 Minute chart. Sellers are absorbing a buying pressure:
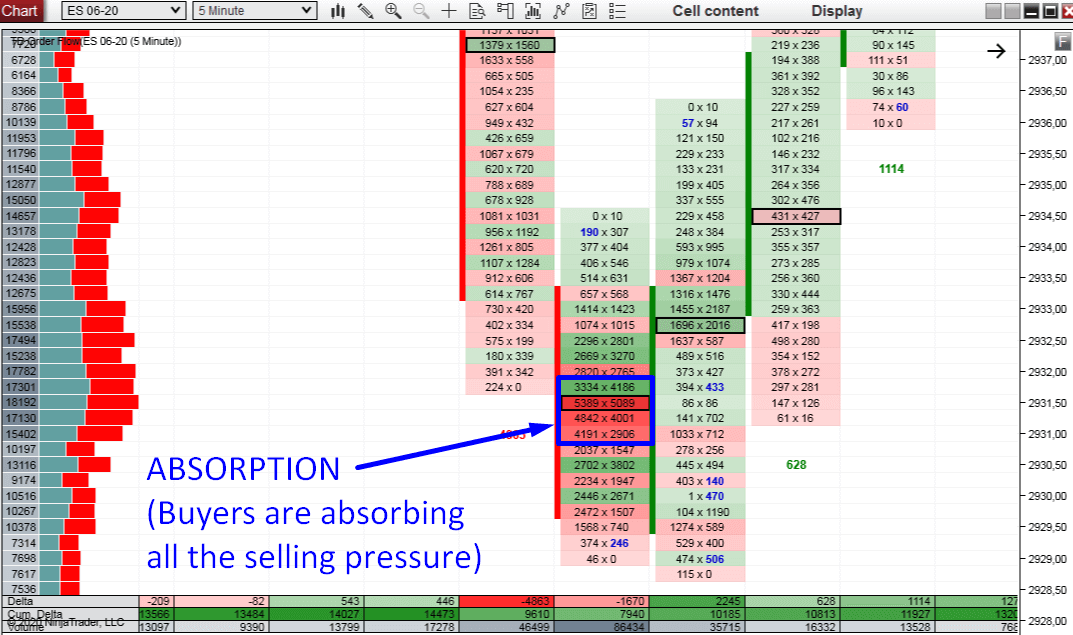
ES (S&P 500 futures), 5 Minute chart. Buyers are absorbing a selling pressure:
Where to get Order Flow?
TD Order Flow Software & Training – Click Here
The Order Flow Package includes Lifetime Access To:- Order Flow software
- Order Flow Video Course (12 hours long)
- Volume Profile Pack
This article was the third part of a four-part Beginners Guide to Order Flow. Here are links to all parts:

Can I use the software for stocks or just FOREX?
You can use it for stocks.
when you make an entry (long or short),do you advise a trailing stop , as we dont know how long it will rally for…. or a fixed TP? thanks
Thank you very much for this beautiful article. This is really great & informative. I read it & learn about many things. I really appreciate your thoughts. Great.
Thanks for liking my article.
Hi,
Do you have set up for NQ or only for ES (futures). Than you.